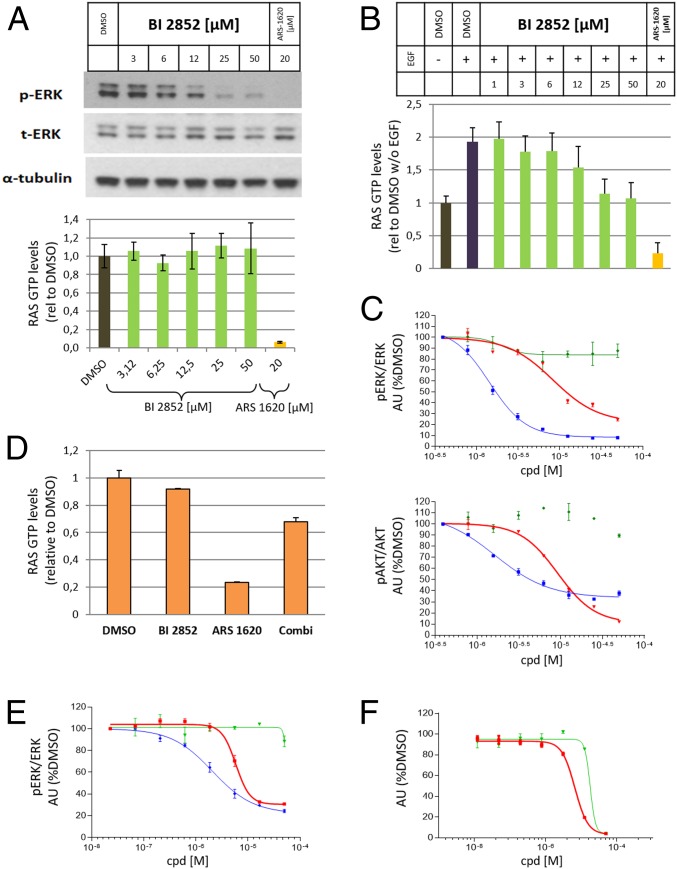
Fig. 6.
Cellular data for BI-2852 (1), distomer 44, and ARS-1620. (A) Western blot of pERK levels versus total ERK and alpha-tubulin under high serum conditions in NCI-H358 cells upon increasing doses of 1 and a fixed concentration of ARS-1620 (Upper) and G-LISA assay measuring GTP-RAS levels under high serum conditions in NCI-H358 cells upon increasing doses of 1 and a fixed concentration of ARS-1620 (Lower). (B) GTP-RAS levels measured with a G-LISA assay in NCI-H358 cells starved for 24 h in low serum conditions (−EGF), followed by 2-h treatment with increasing concentrations of 1 or 20 µM treatment of ARS-1620 and then EGF addition. For quantification, RAS GTP levels without EGF and in the presence of DMSO were set to 1 (A and B). (C) pERK and pAKT levels in NCI-H358 cells starved for 24 h in low serum conditions (−EGF), followed by 2-h treatment with increasing concentrations of 1 (red), 44 (green), and ARS-1620 (blue); then EGF addition were quantified. DMSO-treated samples after EGF stimulation were set to 100%. (D) GTP-RAS levels measured with a G-LISA assay in NCI-H358 cells with treatment of 50 µM compound 1, 20 µM ARS-1620 and simultaneous treatment of 1 and ARS-1620. For quantification, RAS GTP levels in the presence of DMSO were set to 1. (E) pERK dose–response curves for 1 (red), 44 (green), and ARS-1620 (blue) in NCI-H358 cells under high serum conditions. (F) Antiproliferative dose–response curves for NCI-H358 cells in soft agar and low serum conditions for 1 (red) and 44 (blue). DMSO-treated samples were set to 100% (E and F). Error bars indicate SDs. Indicated experiments were performed 2 or more times with similar results.

