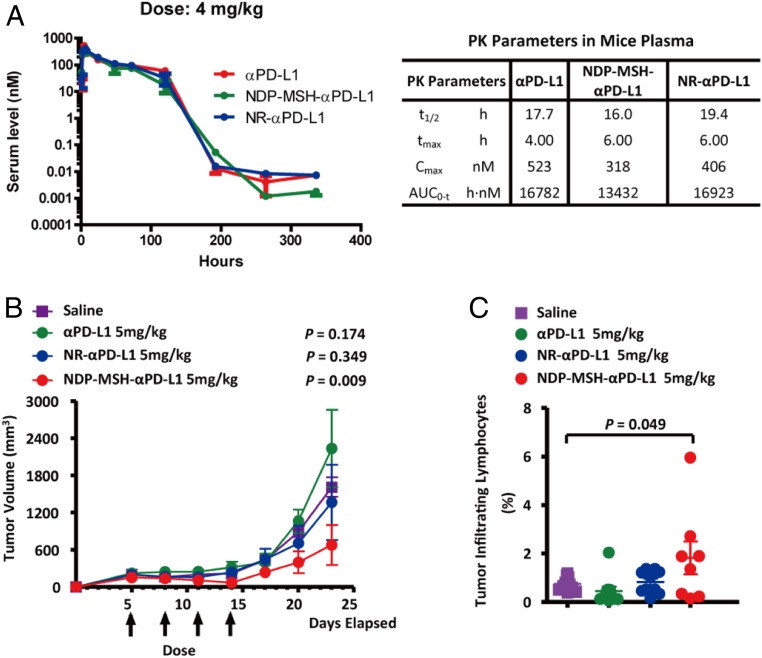
Fig. 4.
Pharmacokinetics and in vivo efficacy of NDP-MSH-αPD-L1. (A) Pharmacokinetics of NDP-MSH-αPD-L1 and controls in the mouse. NDP-MSH-αPD-L1 in PBS or controls was injected intraperitoneally into mice at 4 mg/kg (n = 3/group), and serum was isolated for determination of conjugate concentration. Concentration vs. time curves were evaluated by noncompartmental analysis using WinNonlin. Values shown are averages of 3 mice in the group. t1/2, half-life; tmax, maximum concentration time; Cmax, maximum concentration; AUC0→inf, area under the concentration–time curve extrapolated to infinity. (B) In vivo efficacy of NDP-MSH-αPD-L1 in mouse B16-SIY melanoma syngeneic models (n = 10/group). The tumor was measured 3 times a week with calipers, and the tumor volume was calculated. Each data point represents mean tumor volume of 10 mice in each group ± SD. Arrows indicate the time of drug injection. P values < 0.05 compared with the control groups (saline) were considered significant. (C) Analysis of tumor infiltrating lymphocytes (TILs). C57BL/6 mice (n = 10/group) were injected with B16-SIY cells and treated with saline or αPD-L1-based drugs on days 5, 8, 11, and 14. On day 14, mouse TILs were harvested and analyzed by flow cytometry with the CD3 cell surface marker. P values < 0.05 compared with the control groups (saline) were considered significant.

