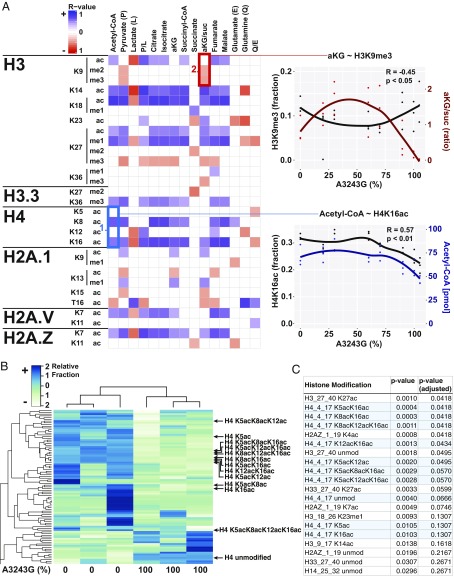
Fig. 1.
MtDNA heteroplasmy modulates metabolites and histone modifications. (A) Seven mtDNA m.3243A > G heteroplasmic cell lines plus the ρ0 parent cells were cultured in parallel for metabolite (j = 15) and histone modification (i = 107) quantification by liquid chromatography tandem mass spectrometry. Spearman correlation coefficient was calculated for each histone modification (unmod = unmodified peptide) against each metabolite (blue = positive, red = negative, and blank = no correlation), with the color intensity corresponding to correlation strength (significance = P < 0.05). (Example #1, blue box) Positive association between acetyl-CoA levels and histone H4 acetylation of lysines 8 (K8) and 16 (K16) across heteroplasmy levels. (Example #2, red box) Negative association between αKG/succinate ratio and histone H3 lysine 9 di- (me2) and trimethylation (me3) across heteroplasmy levels. Each point represents a measurement and lines represent local regression of the mean (R-software loess), n = 3. (B) Heat map of histone acetylation modifications of 0% and 100% m.3243G lines (n = 3), showing a dramatic effect of mtDNA genotype on the histone epigenome. (C) List of top 20 histone modifications ranked by P value, showing the strong effect on mtDNA genotype on H4K5, K8, K12, and K16 acetylation (n = 3). Although it can be argued that modification level changes at a particular site are not independent of either other changes at that site or overall changes in the associated peptide, we also include P values with an arbitrary correction factor, allowing a false discovery rate of 1% (adjusted P value).

