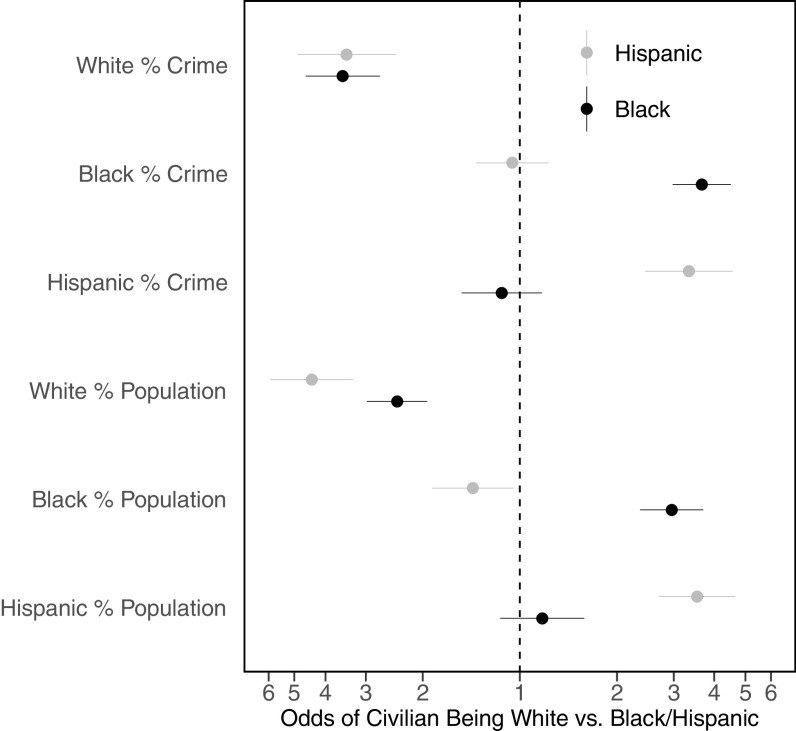
Fig. 1.
Odds ratios predicting the race of civilians fatally shot by police from county-level race-specific violent crime (estimated by race-specific homicide data) and population size. Values to the left (right) of the dotted line indicate that the civilian was more likely to be White (Black/Hispanic). Civilian race was regressed on each variable individually due to multicollinearity. Lines represent 95% CI. n = 917.

