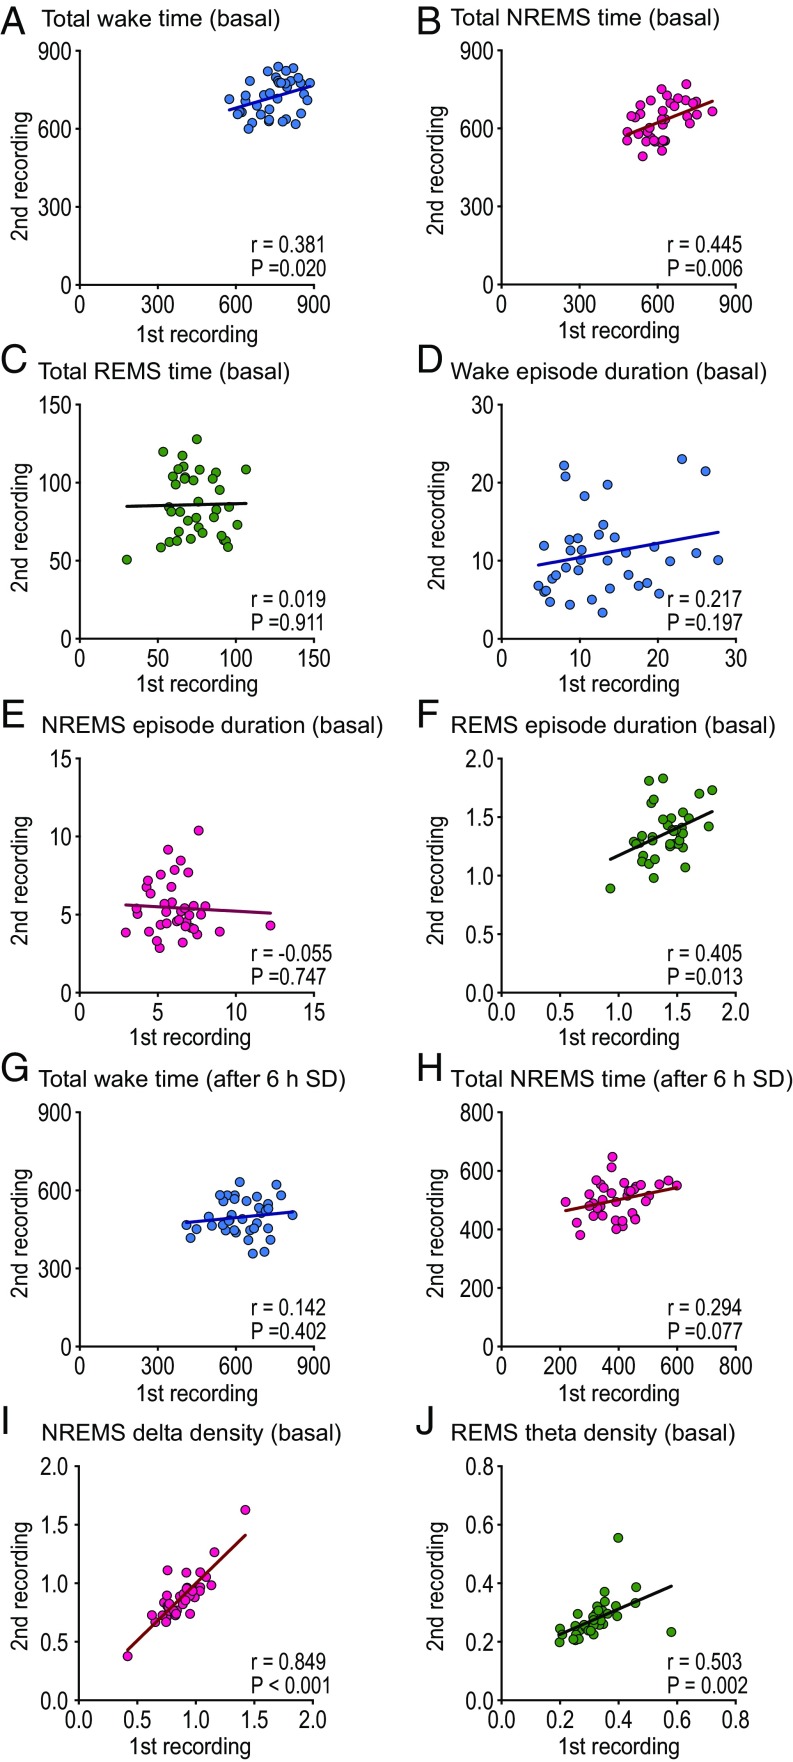
Fig. 3.
Reproducibility of sleep parameters. Reproducibility of basal sleep parameters between first recording (first) and second recording more than 4 wk later (second). Total time (min/24 h) in (A) wake, (B) NREMS, and (C) REMS. Episode duration (min) of (D) wake, (E) NREMS, and (F) REMS. Total time during 18-h period after 6-h sleep deprivation (min) in (G) wake and (H) NREMS. (I) Relative delta density (1–4 Hz) during basal NREMS and (J) relative theta density (6–9 Hz) during REMS. B6J (n = 37). The regression lines are drawn on each graph. Pearson’s correlation coefficient (r) and probability (P) are indicated.

