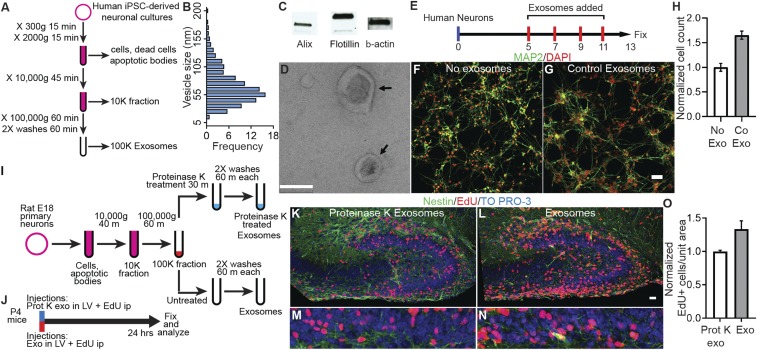
Fig. 1.
Exosomes increase proliferation in vitro and in vivo. (A) Protocol to purify exosomes by sequential ultracentrifugation. (B) Western blot analysis showing exosomal markers Alix and Flotillin in exosomes purified from human iPSC-derived neural cultures. (C) Electron micrograph of purified exosomes. Arrows point to exosomes with typical disk-shaped morphology. (D) Size distribution of exosomes purified from human iPSC-derived neural cultures. Vesicle diameter was calculated from electron micrographs. (E) Protocol for treatment of human primary neural cultures with purified control exosomes (Co Exo) or an equal volume of media (No Exo) added on DIV 5, 7, 9, and 11. Cultures were fixed on DIV 13, labeled, and analyzed. (F and G) Images of human neural cultures treated with media (No Exo, F) or control exosomes (Co Exo, G) labeled with MAP2 antibodies (green) or DAPI (red). (H) Graph of the total cell number in cultures treated with control exosomes compared with media alone (No Exo). Exosome treatment increased total cell number 1.65× ± 0.08 (P = 0.001, n = 4 wells per group, 2-way ANOVA). (I and J) Protocols for preparation of exosomes purified from E18 rat primary neural cultures (I) and treatment of P4 mice (J). Exosomes were purified from serum-free media collected from DIV9 rat neural cultures, and the 100,000 × g exosome pellet was equally divided into 2 tubes. One tube was treated with 100 µg/mL Proteinase K at 37 °C for 30 min to cleave surface proteins, and the other tube was left untreated. P4 mice received exosome injections into the lateral ventricles (LV), followed by intraperitoneal (ip) injections of 25 mg/kg of EdU. The mouse brains were fixed and processed to detect EdU+ cells. (K–N) Images of hippocampal dentate gyrus of P4 mice injected with protein-depleted exosomes (K and L) and untreated exosomes (M and N) showing EdU+ cells (red), Nestin (green) immunolabeling, and TO-PRO-3 nuclear stain (blue). Low-magnification images were used to match identical brain regions (SI Appendix, Fig. S3). EdU+ cells were counted in the boxed regions in dentate gyrus region (K–M), shown at 3.3× zoom in L–N. Proliferation in the granule cell layer (GCL) of the dentate gyrus was quantified by counting EdU+ cells normalized to the area counted. (O) Exosome treatment increased Edu+ cells per unit area 1.34× ± 0.12 (n = 3 mice each) compared with proteinase K-treated exosomes. (Scale bars: C, 0.1 µm; F, G, K, and M, 20 µm.)

