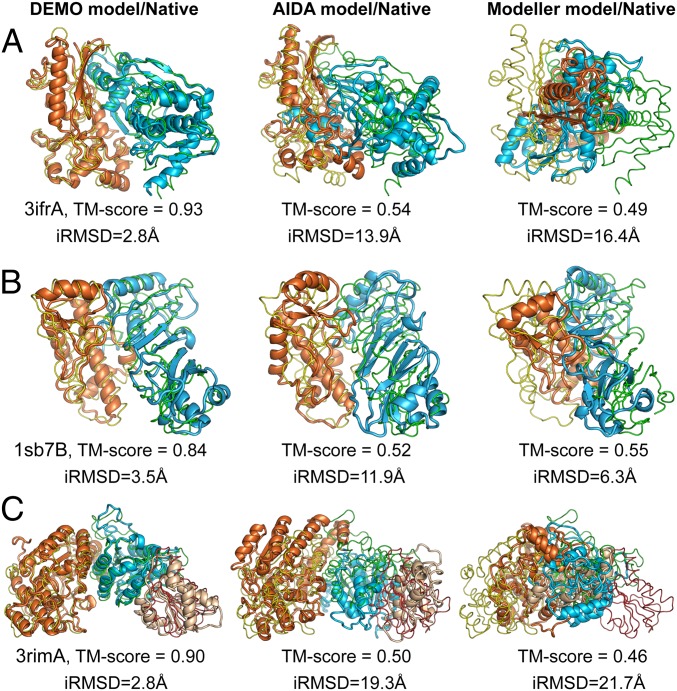
Fig. 4.
Illustrative examples of domain assembly results with domain structure predicted by I-TASSER. The thin lines represent the experimental structures, and cartoons are the final models by DEMO (Left), AIDA (Center), and Modeller (Right), with different colors indicating different domains. (A) 3ifrA. (B) 1sb7B. (C) 3rimA.

