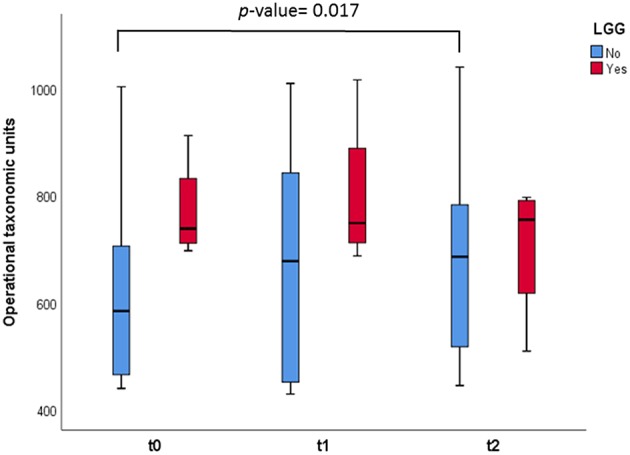
Figure 2.

Box and whisker plots representing measurement of OTUs observed in the fecal samples. The infants were divided in two groups: those who consumed the probiotic LGG (n = 4, in red), and those who did not (n = 8, in green). Comparisons were made with the Wilcoxon signed-rank test to examine the differences over time (t = 0, t = 1, and t = 2).
