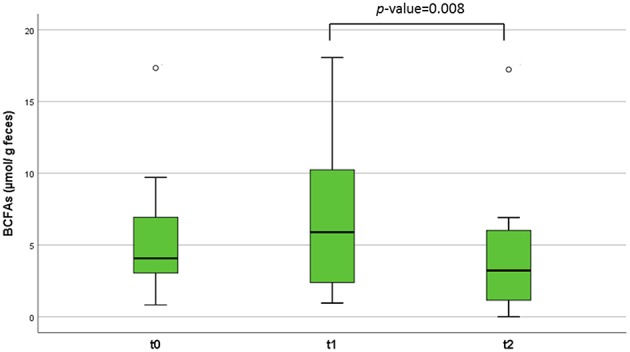
Figure 3.

Branched chain fatty acids (BCFAs) concentration (μmol/g of feces) in the patients' fecal samples at different time points. The lines inside the rectangles indicate the medians and the whiskers the maximum and minimum values. The dots outside the rectangles are suspected outliers. Comparisons were made with the Wilcoxon signed-rank test to examine changes over time (t = 0, t = 1, and t = 2).
