Fig. 1.
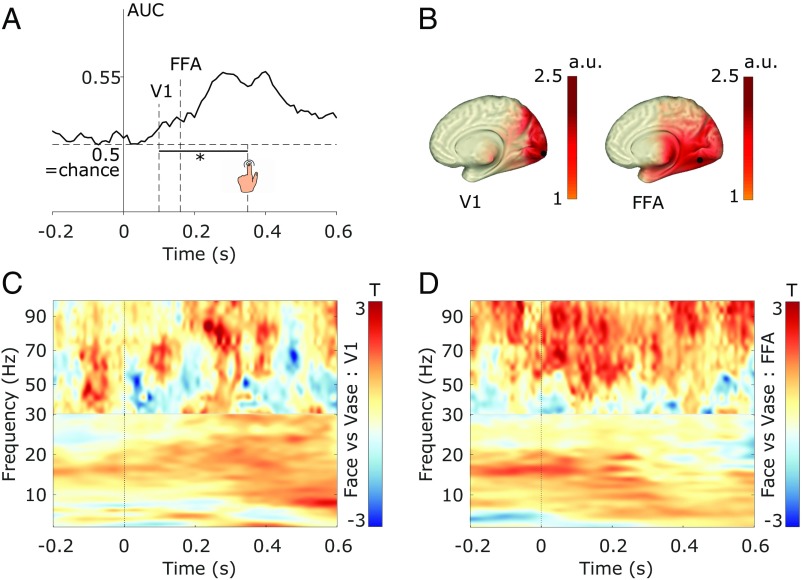
Poststimulus MEG data contains category-sensitive information with respect to the processing of the Rubin face/vase stimulus. (A) Temporal decoding of face vs. vase reports. * represents P = 0.0001 significance of decoding accuracy (t test vs. chance) starting at 100 ms poststimulus. (B) Unmasked activation maps resulting from the source reconstruction of the classifier weights (in arbitrary units [a.u.]), applying a procedure proposed by ref. 39, at different time points, suggesting temporally changing informative regions (V1 ∼100 ms and FFA ∼160 ms after stimulus onset). While the unmasked plots suggest a larger spatial spread of activity at 160 ms compared with 100 ms, applying a 95%-maximum activity threshold to extract the ROIs revealed 32 grid points (8-mm resolution) exceeding the threshold at 100 ms (V1) and 1 grid point exceeding the threshold at 160 ms (FFA). Black dots represent the grid points with maximum informative activity (V1 and FFA) in the respective time periods. (C) Time-frequency contrast in V1 (face vs. vase reports). Colors represent smoothed T-values obtained from cluster-based permutation testing of the contrast (face – vase; ns). (D) Time-frequency contrast in FFA (face vs. vase reports). Colors represent smoothed T-values obtained from cluster-based permutation testing of the contrast (face – vase; pcluster = 0.029). Black lines surround the time-frequency gamma-range cluster that drove the significant statistical difference.

