
Figure 5.
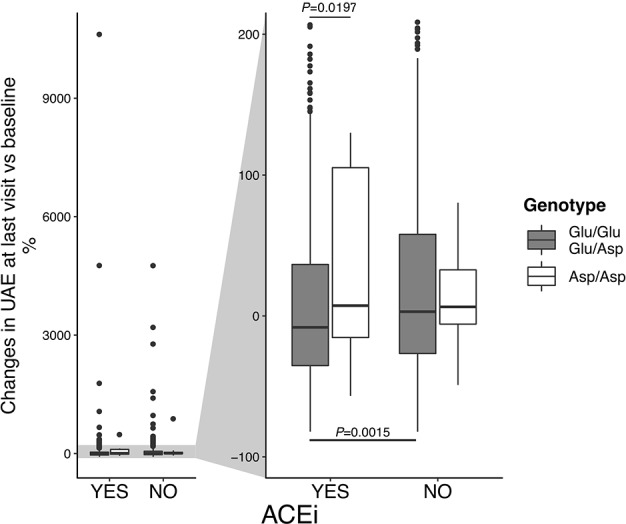
Changes in urinary albumin excretion (UAE) rate, according to p.Glu936Asp polymorphism and ACEi therapy. Percent changes of UAE at last visit vs. baseline. On the left, boxplots on the entire data range. On the right, boxplots were zoomed to show median (the central line) and IQR (lower and upper hinges).