
FIGURE 2.
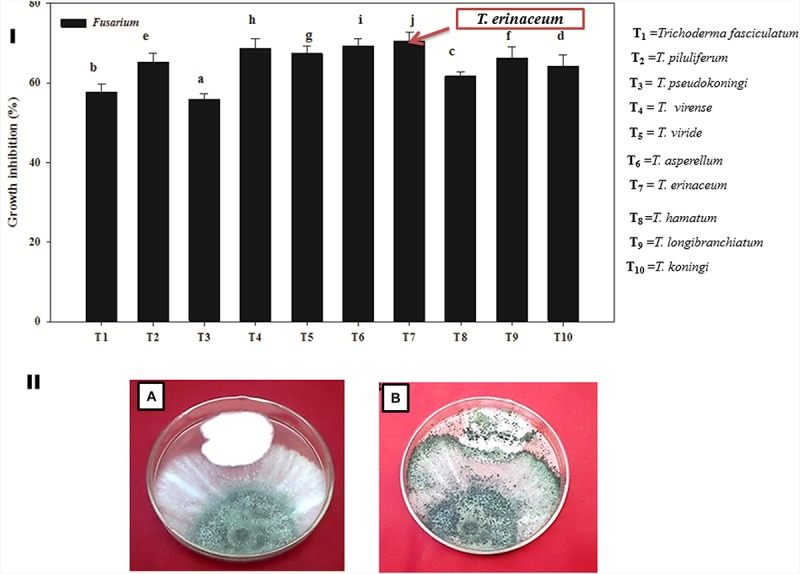
(I) Bar graph showing the efficacy of different species of biocontrol agent Trichoderma spp. in inhibiting the mycelial growth of the Fol pathogen. The figure represents the in vitro mycoparasitic interaction of different isolates of Trichoderma spp. (T1–T10) against the Fol pathogen through dual culture assay. The bar graphs represent the percentage growth inhibition of the pathogenic hyphae (Fol) by different species of Trichoderma employed in the study. The T. erinaceum (T7) showed the maximum inhibitory action against the Fol pathogen. (II) The Dual culture Assay showing the in vitro mycoparasitic and antagonistic activity of Trichoderma spp. against the pathogen Fusarium oxysporum f. sp. lycopersici. (A) Culture plate showing the mycoparasitic behavior of Trichoderma spp. and the Fol pathogen 5 days post inoculation. (B) The mycoparasitic activity of the Trichoderma showing the growth over the Fol pathogen and the picture was taken 10 days post inoculation of the Trichoderma spp. and the Fol pathogen (inoculated simultaneously). Mean (±SE) was calculated from three replicates for each treatment. Bars with distinct letters are significantly different at P ≤ 0.05 using the DMRT test.