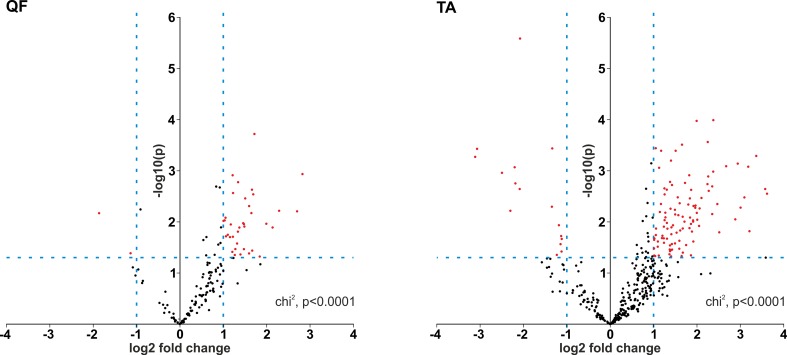
Figure 4.
Prevalence of circRNAs with increased levels in DM1. Volcano plots depicting differences in the levels of “common” circRNAs (dots) in DM1 and control samples in QF (left-hand side) and TA (right-hand side). Positive and negative values of log2 fold change indicate increased and decreased circRNAs in DM1. Each red dot represents circRNA fulfilling the following criteria of expression change: p-value <0.05 and log2 fold change ≤−1 or ≥1 (the thresholds indicated by dotted lines).

