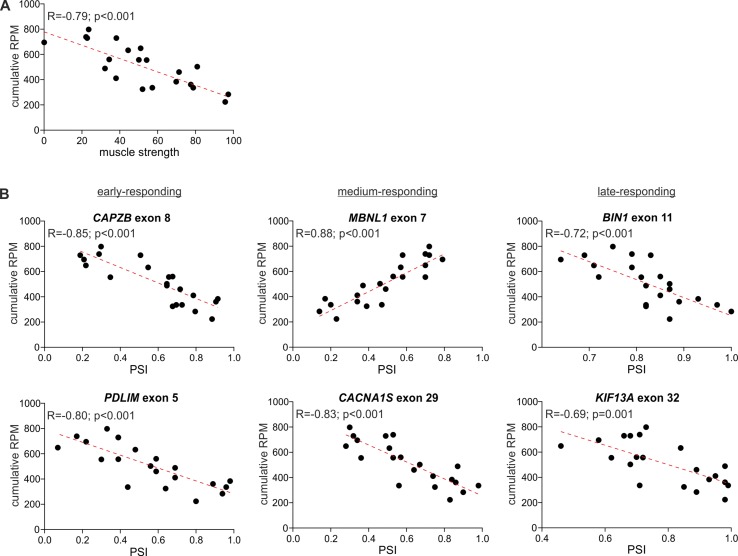
Figure 6.
Correlation of global circRNA level with disease severity. For each plot, the R-value, p-value, and the trendline (red-dotted line) are shown. (A) A scatter plot showing the correlation of global circRNA levels normalized as RPMs (Y-axis) and muscle strength (X-axis). (B) Scatter plots showing correlations of global circRNA levels (Y-axis) and PSI values of early-, medium-, and late-responding exons alternatively spliced in DM1 (X-axis). Each dot represents an individual TA sample.

