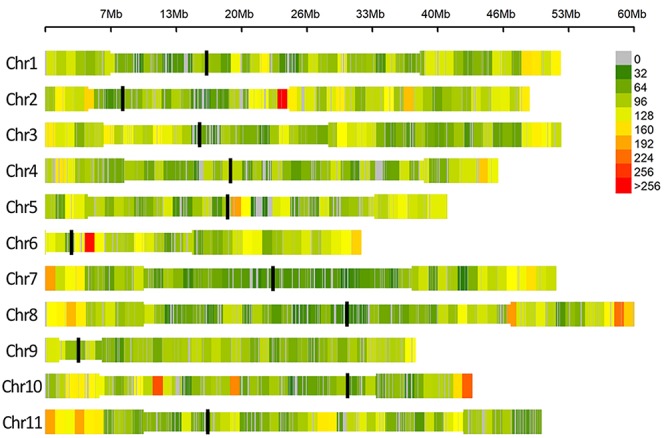
FIGURE 3.

SNP density within 1 Mb window size, different colors represent different density levels. In the Figure “Chr” refers to common bean chromosomes, where centromeric (black line) and pericentromeric regions (thinner bar sections) are reported according to Schmutz et al. (2014).
