Figure 2.
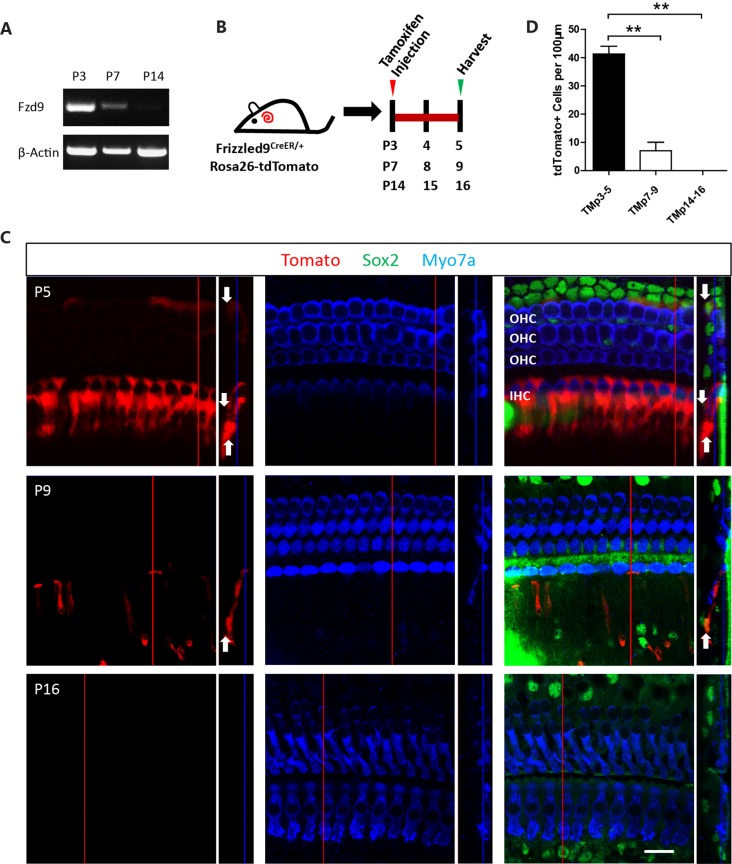
The spatiotemporal expression of Fzd9 in the cochlea at different time points. (A) RT-PCR showed Fzd9 mRNA expression at P3, P7, and P14. β-actin was used as the internal control. (B) Tamoxifen was I.P. injected into P3, P7, and P14 Fzd9-CreER/Rosa26-tdTomato mice to activate cre, and the cochleae were dissected 48 h later to determine the tdTomato expression pattern, which shows Fzd9 expression at different time points (C). Myo7a was used as the HC marker, and Sox2 was used as the SC marker. The large square images are single XY slices, the vertical red line shows the position of the orthogonal slice that is shown to the right of each panel, and the blue line on the orthogonal slice shows the level of the XY slice to the left. Orthogonal projections of tdTomato+ cells are indicated by white arrows. Scale bar, 20 μm. (D) Quantification of tdTomato+ cells at each time point. n = 3 for both Lgr5 and Fzd9 mice. **p < 0.01.

