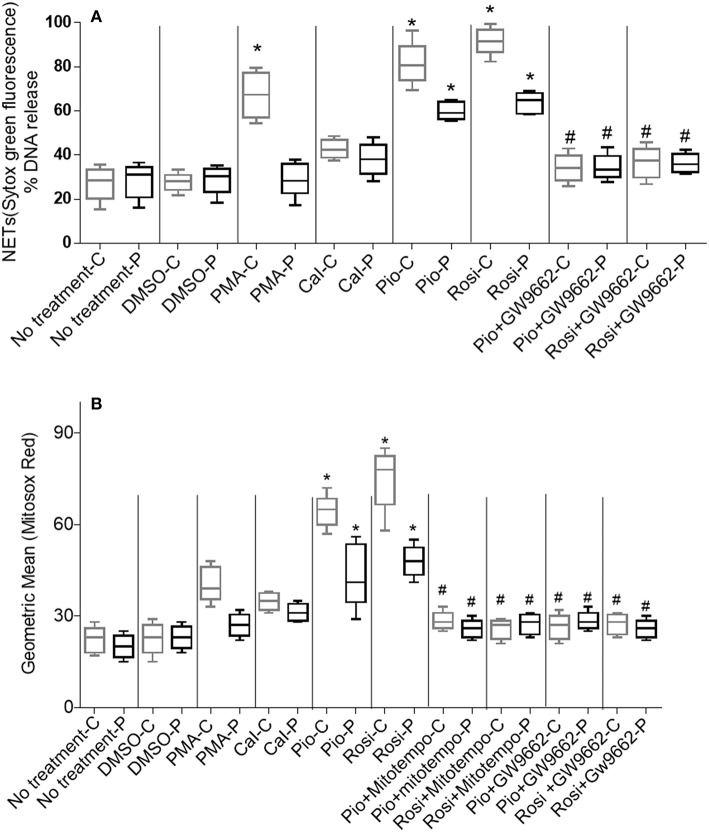
Figure 3.
(A) Quantitation of NETosis using Sytox green by fluorimetry. Neutrophil extracellular trap (NETs) formation was quantified by fluorimetry after treatment of neutrophils from control and CGD cohort with PPARγ agonists only/PPARγ agonist + antagonist treatment, using 5 μM Sytox green dye. % DNA release was calculated. Graph shows mean ± SD from three independent experiments for each patient. Statistically significant comparisons were obtained by unpaired t-tests and comparisons are as follows: *Respective patient/control cohort compared to untreated cells (p < 0.0001). #Respective patient/control cohort compared to respective agonists only (p < 0.001). -C, controls; -P, patients; PMA, phorbol myristate; Cal, calcium ionophore; Pio, pioglitazone; Rosi, rosiglitazone. (B) Quantitation of mitochondrial ROS using MitoSOX red by fluorimetry: PPARγ agonist treatment enhances production of mitochondrial ROS by neutrophils from control and CGD patient neutrophils with or without MitoTempo (Mitochondrial ROS inhibitor)/with or without GW9662 treatment. Mitochondrial ROS was quantified by MitoSOX red and represented as geometric mean. Graph shows mean ± SD from three independent experiments for each subject. *Respective patient/control cohort compared statistically with respective untreated cells of patient/control (p < 0.05). #Respective patient/control cohort compared statistically with respective group agonists only (p < 0.05).

