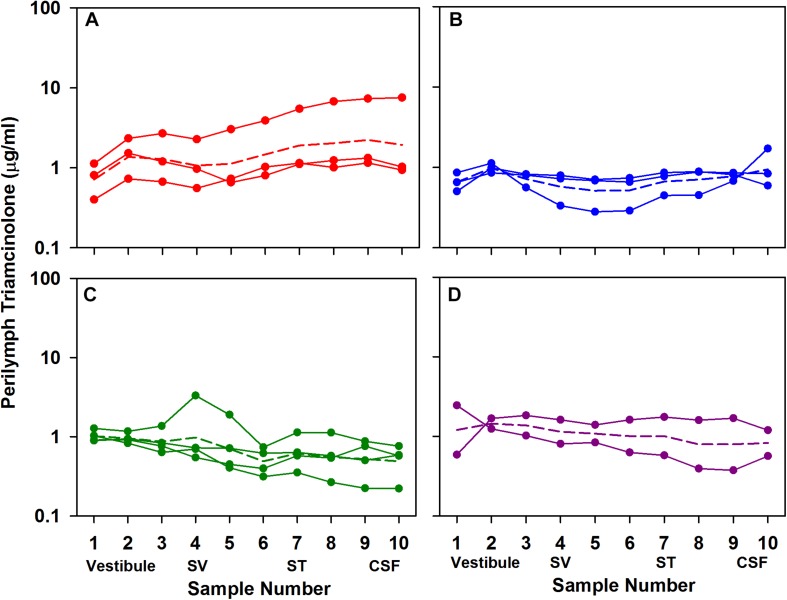
FIGURE 4.
Perilymph triamcinolone concentrations measured 1 h (A), 3 h (B), 1 day (C), and 3 days (D) after application of triamcinolone suspension to the RW niche of guinea pigs. Perilymph was collected as 10×2 μL sequential samples each of which was analyzed independently. Each curve shows the measured data from a single animal. Animal numbers in each group were 3, 3, 4, and 2, respectively. For each group the mean is shown as a dotted line.

