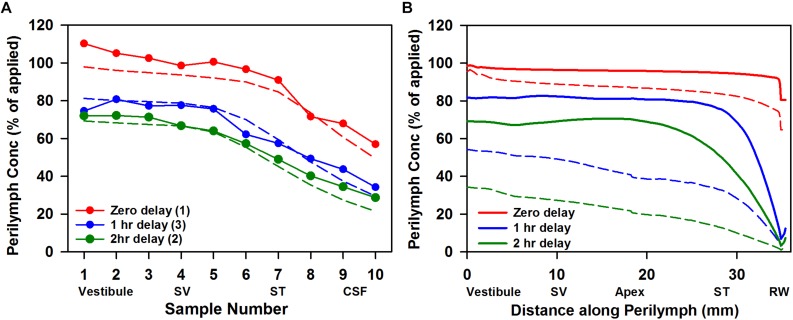
FIGURE 5.
(A) Elimination measurement of triamcinolone. Solid lines with symbols are the group means of the number of experiments indicated in which triamcinolone concentrations of perilymph samples obtained by sequential sampling were measured either immediately (zero delay; red curve, n = 1), 1 h (blue curve, n = 3), or 2 h (green curve, n = 2) after perilymph loading. Dotted lines show calculated sample concentrations derived by simulation with elimination half time 700 min for ST and 278 min for SV; parameters which best fit this data set. (B) Solid lines show the distribution of triamcinolone along the perilymphatic space at zero, 1 and 2 h delay after loading calculated using the same parameters. For comparison, curves calculated based on a best fit to dexamethasone sampling data are shown dotted (ST elimination: 46 min; SV elimination 91 min; Salt et al., 2018).

