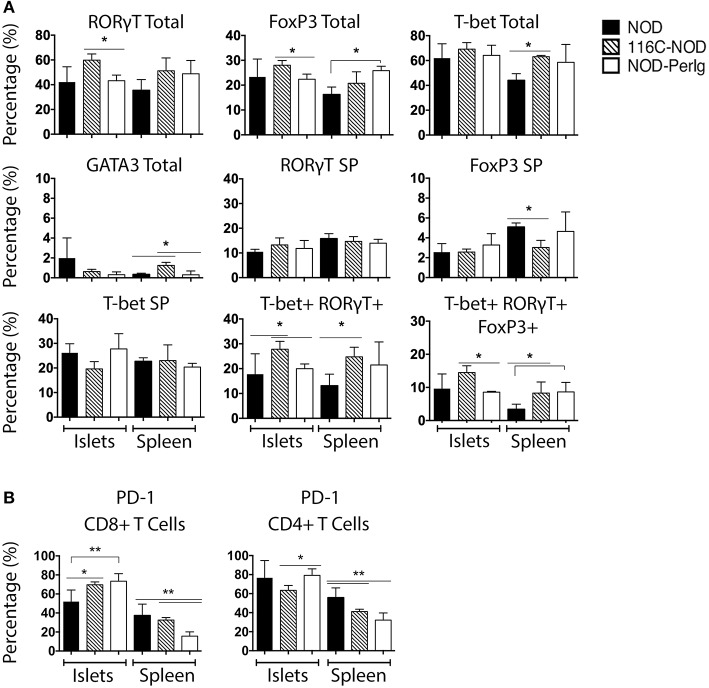
Figure 3.
Phenotype of unstimulated splenic and islet infiltrating NOD, 116C-NOD, and NOD-PerIg T-lymphocytes. (A) T-bet, RORγt, GATA3, and FoxP3 expression was assessed by flow cytometry in splenic and islet-infiltrating T-lymphocytes from 6-week-old female NOD, 116C-NOD and NOD-PerIg mice (n = 4 per group, with two replicates for each experimental condition). “Total” and “SP” stand for the percentage of “whole positive” and “single positive” cells for the aforementioned marker, respectively. (B) Expression of PD-1 was analyzed by flow cytometry in the spleen and islet-infiltrating T-lymphocytes from 6-week-old female NOD, 116C-NOD and NOD-PerIg mice (n = 4 per group, with two replicates for each experimental condition). Bars show the SD of the percentage values. Mann-Whitney U, statistically significant differences: *P < 0.05 or **P < 0.01.

