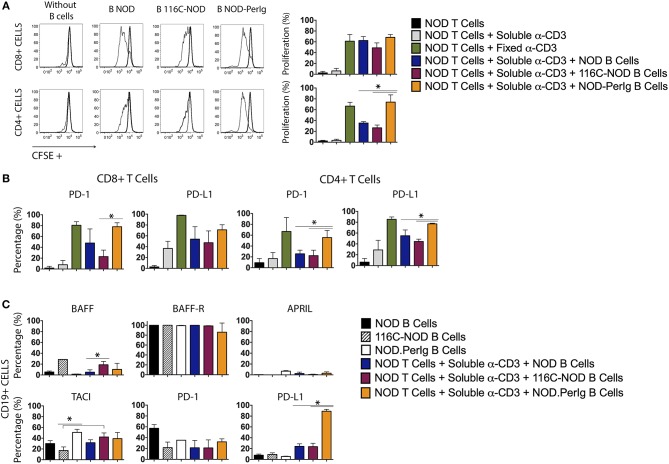
Figure 4.
Proliferation assay and molecular marker expression by NOD T-lymphocytes co-cultured with B-lymphocytes from NOD, 116C-NOD, and NOD-PerIg mice. (A) NOD T-lymphocyte proliferation assay. Purified splenic T-lymphocytes from NOD mice were CFSE-labeled and cultured in the presence (narrow line) of soluble anti-CD3, or plate-coated anti-CD3, and either purified NOD, 116C-NOD, or NOD-PerIg B-lymphocytes plus anti-CD3, or without stimulus (bold line) for 72 h. Ten NOD mice were used to obtain the T-lymphocyte pool and 4 mice of each group to obtain purified B-lymphocytes. Two replicates were carried out for each experimental condition. The proliferation of CD4+ or CD8+ T-lymphocytes was analyzed independently. (B) The expression of PD-1 and PD-L1 in CD4+ and CD8+ NOD T-lymphocytes was analyzed after co-culturing them as previously described. (C) The proportion of NOD, 116C-NOD, and NOD-PerIg B-lymphocytes expressing BAFF, APRIL, BAFF-R, TACI, PD-1, or PD-L1 was also assessed. All B-lymphocytes were incubated alone without stimulus or in the presence of NOD T-lymphocytes plus anti-CD3 for 72 h (n = 4 per group, with two replicates for each experimental condition). Bars show the SD of the percentage values. Mann-Whitney U, statistically significant differences: *P < 0.05.

