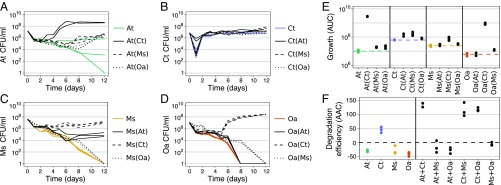
Fig. 1.
Comparison of mono- and pairwise cocultures. (A−D) Population size quantified in colony-forming units per milliliter over time for monocultures (in color) and pairwise cocultures (in black; coculture partner indicated in brackets). In the cocultures, each species could be quantified separately by selective plating. Each panel shows the data for 1 species: (A) A. tumefaciens (At), (B) C. testosteroni (Ct), (C) M. saperdae (Ms) and (D) O. anthropi (Oa). (E) AUC in A−D. Dashed lines indicate the mean of the monocultures, shown in color. Statistical significance and interaction strengths are calculated based on combined data from this and the repetition experiment (SI Appendix, Fig. S1), and shown in Fig. 3 and Dataset S1. (F) AAC describing the decrease in COD (see Materials and Methods) (i.e., degradation efficiency; SI Appendix, Fig. S6 A and B). Negative AAC values arise because dead cells increase the COD (SI Appendix, Fig. S7). AUC (E) and AAC (F) correlate positively (SI Appendix, Fig. S4).

