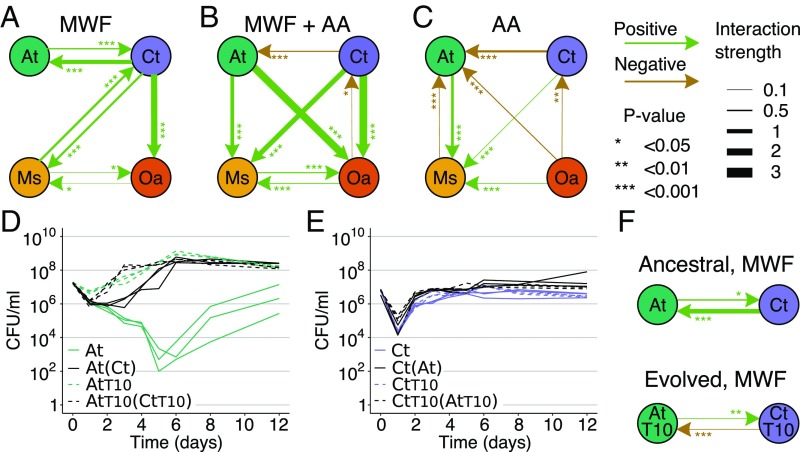
Fig. 3.
Pairwise interaction networks under different environmental conditions. Positive/negative interactions indicate that the species at the end of an arrow grew significantly better/worse in the presence of the species at the beginning of the arrow in (A) MWF, (B) MWF + AA, and (C) AA medium. Arrow thickness represents interaction strength as the 10-fold change in the coculture AUCs compared with monoculture AUCs, i.e., by how many orders of magnitude a species changed the AUC of another. Statistical significance and interaction strengths were calculated based on 2 experiments in A (data in Fig. 1 and SI Appendix, Fig. S1), and 1 experiment in B (SI Appendix, Fig. S9) and C (SI Appendix, Fig. S8). P values and interaction strengths are listed in Dataset S1. (D) Monoculture and coculture growth curves of ancestral At and (E) Ct versus the same strains evolved in monoculture for 10 wk (AtT10, CtT10). Coculture partners are indicated in brackets. (F) Interactions between ancestral and evolved At and Ct strains based on growth curves in D and E. Arrow widths and asterisks are as defined for A–C. The interactions between At and Ct in A and F have different strengths and P values because they come from different experimental repeats.

