Fig. 5.
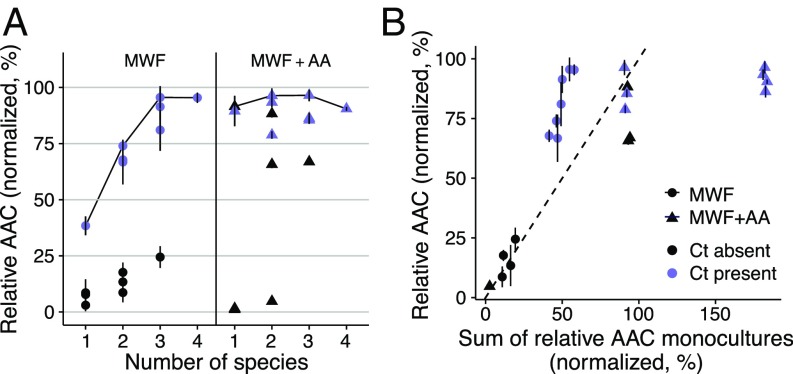
Degradation efficiency as a function of species number. (A) AAC of COD (see Materials and Methods), normalized to values between 0 and 100%. Points show the mean of a culture treatment composed of 1 to 4 species, and vertical lines show standard deviations. Blue (or black) points show cultures where C. testosteroni was present (or absent). Cultures growing on MWF (Left) only reach their maximum degradation potential once 3 species are present (see black line connecting the maximum mean values). In MWF + AA (Right), even single species can degrade as efficiently as the best cultures. In a more benign environment, there is less need for a diverse community. (B) Prediction of an additive model of the sum of degradation efficiencies of individual species is plotted against degradation efficiency of the cocultures in both growth media. Data points are identical to >1 species in A. In MWF, cocultures are more efficient than the sum of the corresponding monocultures (most points above dashed line), while, in MWF + AA, they are equally or less efficient (most triangles below the dashed line). The presence of C. testosteroni explains much of the AAC in A and B.

