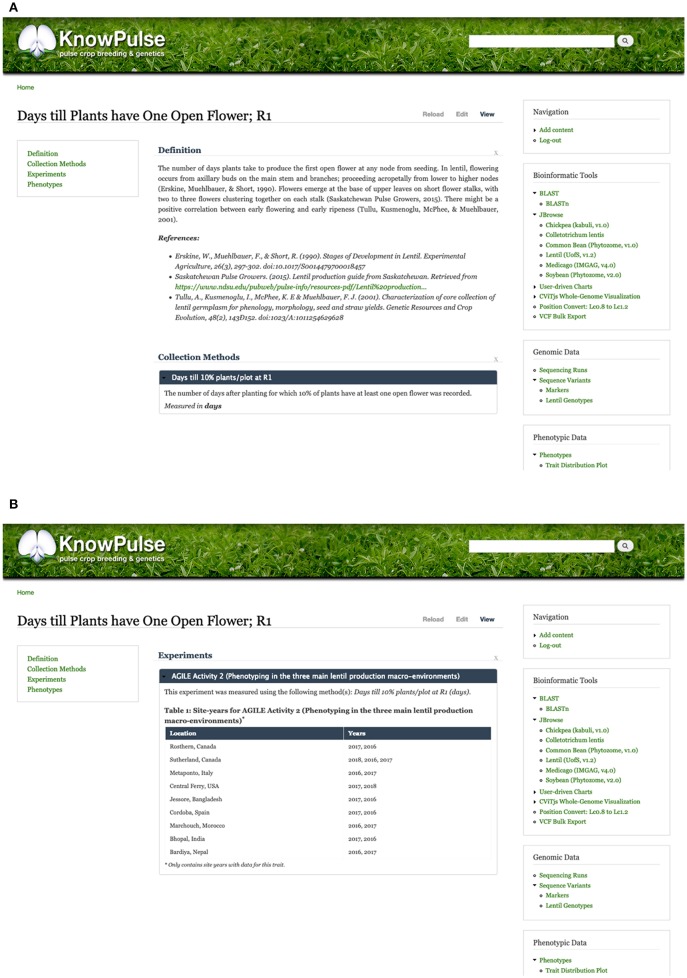
Figure 5.
KnowPulse trait pages. Each trait page describes the methods and units used for collecting the data (A) and lists all experiments the trait was measured in (B). This information provides context to help researchers better interpret the data. The trait distribution plot shown in Figure 4 is also available on each trait page. Trait pages can be accessed via the crop-specific trait search in the right side menu under phenotypic data.

