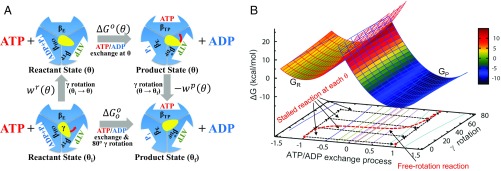
Fig. 2.
(A) Thermodynamic cycle connecting the stalled/controlled rotation at the γ-rotation angle (Upper) and freely rotating systems (Lower) for the 80° rotation step. In the freely rotating system, and refer to the γ-rotation angles at the resting reactant and product states, respectively. (B) FE diagram of the ATP/ADP exchange process for the stalled- and free-rotation systems determined based on the reorganization energy and values with = 16 pN·nm. value is a function of and the 2 work functions (see also SI Appendix, Fig. S2). For the ATP/ADP exchange process, “−1” denotes the reaction coordinate (RC) value at the reactant state and “1” at the product state, respectively. In the Marcus theory FE diagram (upper surface), the parabola shown in red mesh is the FE surface of the reactant state and the blue mesh is for the product-state FE surface . The transition state is where the 2 parabolas intersect. In the reactant state, the FE value of (at RC = −1) increases by the term with the increase of θ from 0° to 80°; the FE also increases similarly for the angle less than 0°. In contrast, the FE of (at RC = 1) decreases by in the product state as increases. The free-rotation reaction, i.e., the ATP/ADP exchange process in the freely rotating system (shown in red dashed line), is indicated by following the minimum FE values in the FE surface. In this diagram, the barrier height relative to (i.e., the FE of the resting reactant state) is relatively insensitive to the change of , whereas [i.e., the barrier relative to ] decreases as increases (SI Appendix, Fig. S2).

