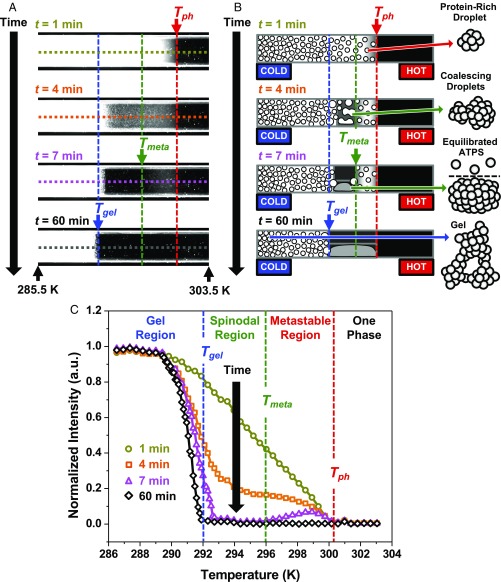
Fig. 2.
ATPS formation of a mAb solution on the temperature gradient device. (A) Dark-field images at time points ranging from t = 1 to t = 60 min during the experiment. The 2, short upward-pointing black arrows at the bottom of the image denote the temperatures at each of these 2 points, respectively, while the colored arrows denote the positions of the 3 transition temperatures. (B) Schematic diagrams of ATPS formation along the temperature gradient device corresponding to the time points in A. The schematics on the right are drawn from a side-on perspective of the rectangular capillary tube. The droplet cartoons on the far-right side depict more detailed structures corresponding, in descending order, to a protein-rich droplet, 2 coalescing droplets, an equilibrated ATPS, and the gel state, respectively. The protein molecules are depicted as gray spheres in each droplet cartoon. (C) Line scans of scattering intensity versus temperature. The line scans plotted in C correspond to the dashed horizontal lines in the images in A, which are color coded accordingly. The dashed vertical lines denote the 3 phase transition temperatures.

