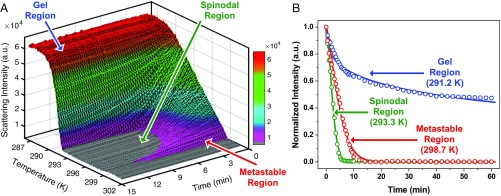
Fig. 3.
Kinetic analysis of the light scattering data obtained in Fig. 2. (A) The scattering intensity is plotted as a function of both time and temperature. The data are shown at 15-s time intervals for clarity. (B) Three isothermal decays of the normalized scattering intensity as a function of time from the 3 distinct kinetic regions along the temperature gradient. The open circles are data points and the solid lines are fits to the data using Eq. 1.

