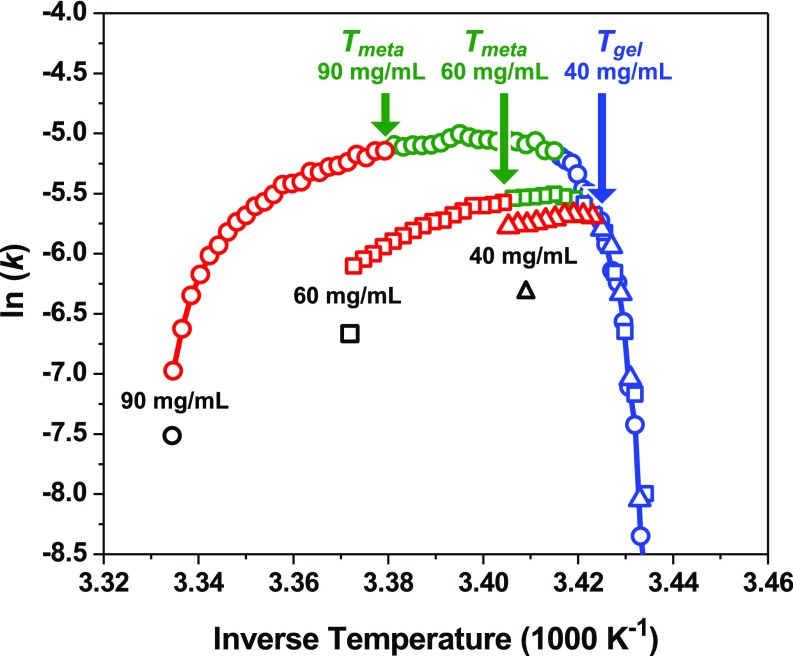
Fig. 5.
Arrhenius plots for the kinetics of ATPS formation in solutions containing 90 mg/mL (circle data points), 60 mg/mL (square data points), and 40 mg/mL (triangle data points) mAb in the presence of 20 mg/mL PEG-3350. The natural log of the rate constants, ln(k), for each mAb concentration versus inverse temperature is divided into metastable (red data points), spinodal (green data points), and gel (blue data points) regions. The solid red and blue curves are provided as guides to the eye.

