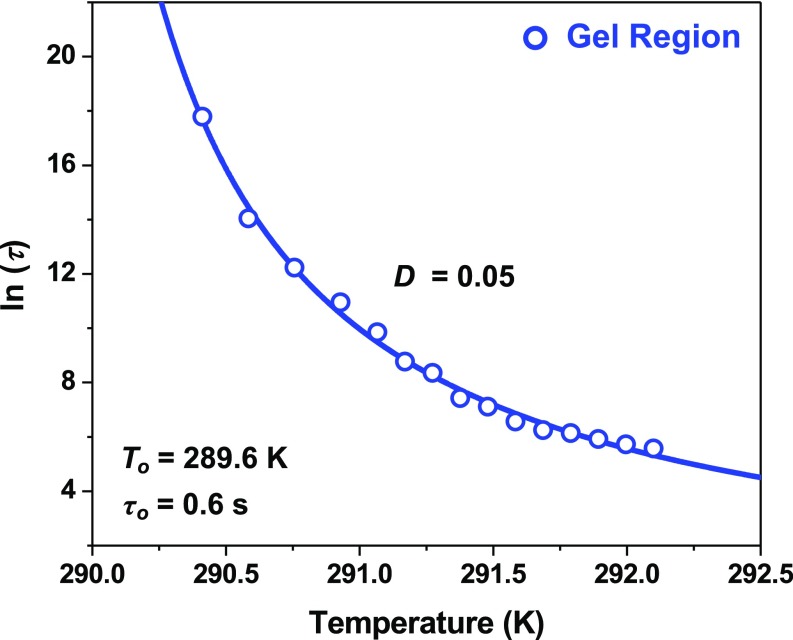
Fig. 6.
Time constants for ATPS formation as a function of temperature near Tgel for a solution of 90 mg/mL mAb and 20 mg/mL PEG-3350. The natural log values of the time constants, ln(τ), in the gel region, where β < 1, are plotted as blue data points along with the fit to the VFT model, shown as a solid blue curve.

