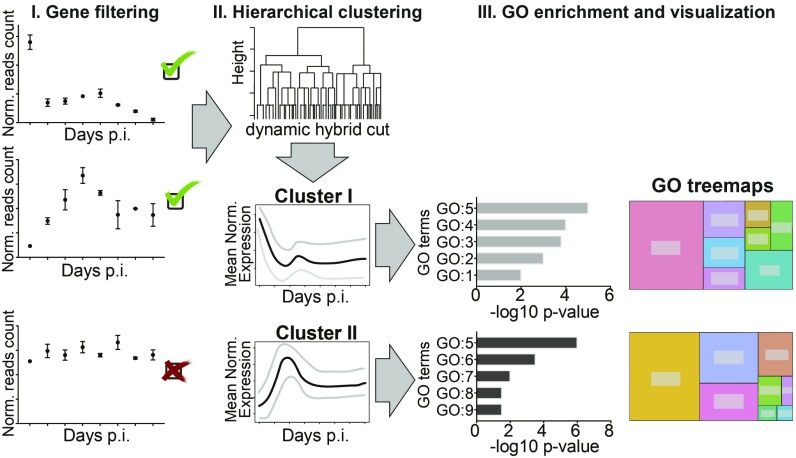
Fig. 3.
Workflow of the bioinformatic analysis and gene clustering. The schematic overview represents the 3 main steps of the bioinformatic analysis: gene filtering, hierarchical clustering, and GO enrichment and visualization performed to identify specific clusters of DE genes and related biological processes. The SI Appendix, Materials and Methods provides the details to this analysis.

