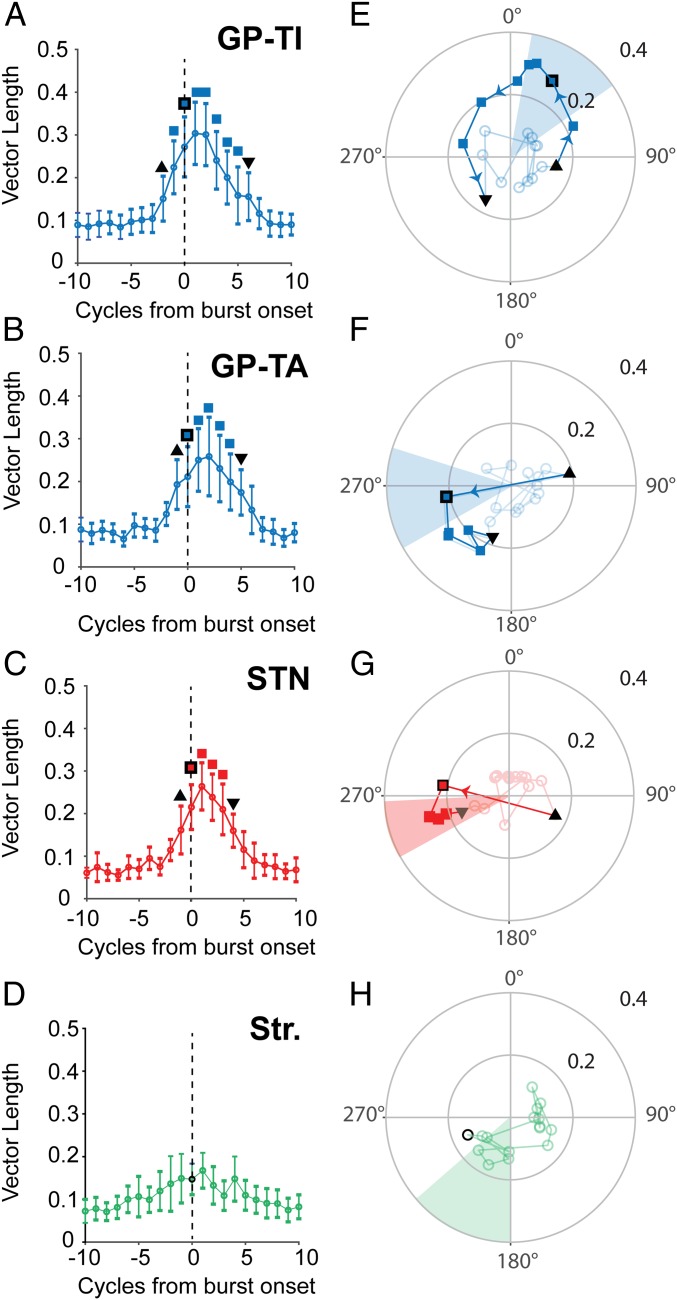
Fig. 5.
Temporal evolution of cortical and basal ganglia phase locking conditions during cortical β bursts. (A–D) Mean vector length with 1 STD (error bars) of the phase-locking action potentials to ECoG beta phase in the 10 oscillation cycles on either side of that containing the ECoG β-burst onset (cycle 0; dotted line) for the spikes of GP-TI (A; n = 151), GP-TA (B; n = 31), STN (C; n = 19), and striatal (D; n = 20) neurons. Symbols above data points indicate significant increases in vector length compared with any of the previous cycles (Kruskal–Wallis ANOVA with post hoc Dunn–Cidek tests). Black triangle, first significant increase in vector length; colored square with black outline, cycle containing burst threshold; inverted black triangle, last cycle with significantly increased vector length; colored squares; all other cycles with significantly increased vector length. The vector lengths of GP-TI, GP-TA, and STN neurons (A–C) were significantly different between cycles (Kruskal–Wallis ANOVA, P < 0.002), and post hoc tests showed that these differences occurred around the burst threshold. The vector length of striatal neurons (D) was significantly modulated by cycle position (Kruskal–Wallis ANOVA, P = 0.0012), but no individual cycle was significantly different to those occurring previously. (E–H) Preferred phase angle of spikes of each neuron type in each cycle. Each symbol shows the average vector length (distance from center) displayed in A–D, together with the corresponding preferred phase angle (position on circle) of spikes in each beta cycle. Faded circles show cycles with no significant increase in vector length. The remaining symbols are matched to the points on A–D so that progression in phase can be compared with that in vector length in relation to the burst threshold. Lines between the symbols indicating the cycle-to-cycle progression. The shaded areas show 1 STD around the mean β-phase, calculated across whole recordings, for each population. Significant changes in angle between consecutive preferred phases with significant vector length are denoted by the colored arrows (Watson–Williams test, P < 0.01).

