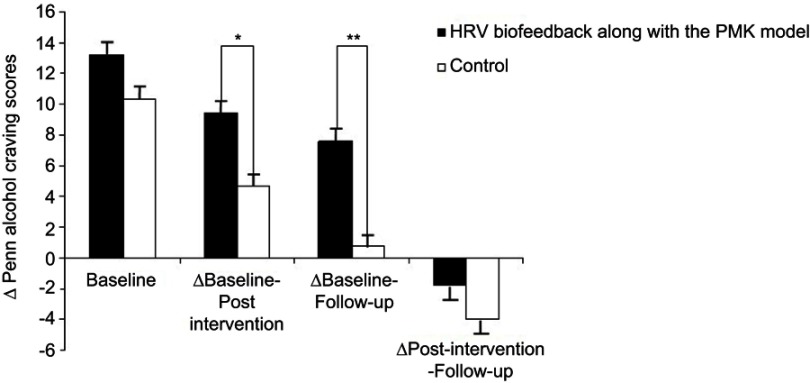
Figure 5.
The bar graph showed the difference of craving scores among two group samples who received HRV biofeedback along with the PMK model (black bars) and the group who received only the PMK model (white bars) that were separately displayed at baseline, ∆Baseline-Post-intervention, ∆Baseline-Follow-up, and ∆Post-intervention- Follow-up.
Notes: **P>0.01; *P<0.05. ∆Penn alcohol-craving scores, differences of Penn alcohol-craving scores; ∆Baseline-Post-intervention, differences of Penn alcohol-craving scores between baseline and post-intervention; ∆Baseline-Follow-up, differences of the Penn alcohol-craving scores between baseline and follow-up; ∆Post-intervention-Follow-up; differences of the Penn alcohol-craving scores between post-intervention and follow-up.
Abbreviations: HRV, heart rate variability; PMK model, Phramongkutklao model.

