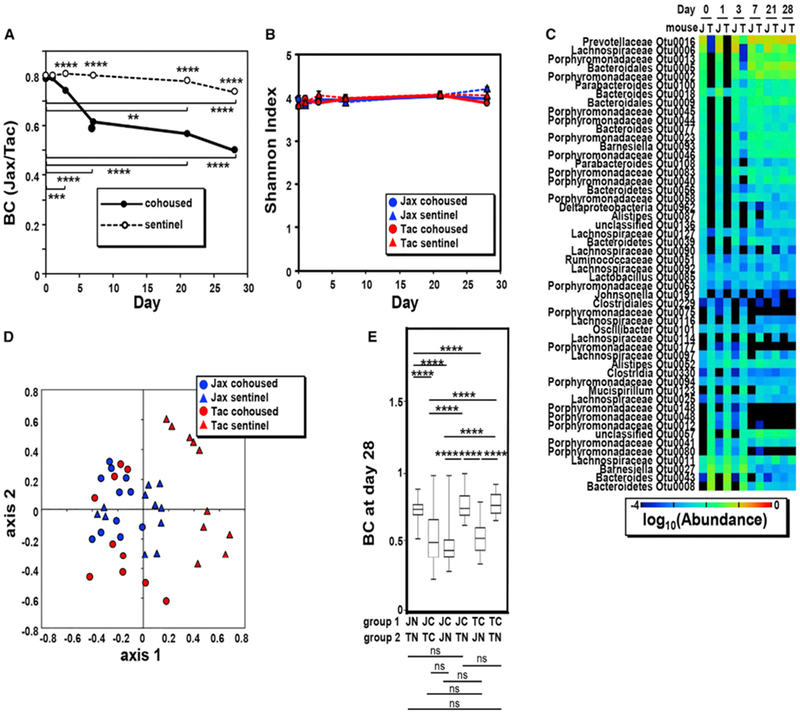
Figure 3. Microbiota Normalization during Cohousing.

(A) β-diversity BC index between fecal microbiotas of cohoused and sentinel mice during 4 weeks (the numbers of cohoused and sentinel Jax and Tac mice are the same as shown in Figure 2). Data are expressed as the median from four independent experiments. The asterisks above symbols indicate differences between cohoused and sentinel populations. ****p < 0.0001 (Kruskal-Wallis test followed by Dunn’s multiple comparisons test), whereas asterisks with bars indicate the differences between day 0 and the indicated days. **p < 0.01, ***p < 0.001, and ****p < 0.0001 (Friedman test followed by Dunn’s multiple comparisons test).
(B) α diversity (Shannon diversity index) of fecal microbiotas of cohoused and sentinel mice during 4 weeks. Data are expressed as mean ± SEM from four independent experiments. All α diversities of fecal microbiotas, except sentinel Jax mice on day 0 versus day 21 and on day 0 versus day 28 (p < 0.05) (one-way ANOVA followed by Dunnett’s multiple comparisons test), show no difference over time.
(C) Heatmap of the average abundance of indicated OTUs that were significantly different in Jax and Tac mice before cohousing.
(D) NMDS plot of BC indexes between cohoused (circle) and sentinel (triangle) Jax (blue) and Tac (red) mice at day 28 after cohousing is shown with the minimal stress (stress = 0.252948) after 1,000 iterations. See also Table S1.
(E) Boxplots showing BC indexes between cohoused (C) and non-cohoused (N) Jax (J) and Tac (T) mice at day 28 after cohousing. ****p < 0.0001; n.s., not significant (Kruskal-Wallis test followed by Dunn’s multiple comparisons test). See also Figure S3. Boxes represent the interquartile range between the first and third quartiles (25th and 75th percentiles, respectively), the horizontal line inside the box defines the median, and whiskers represent the lowest and highest values.
