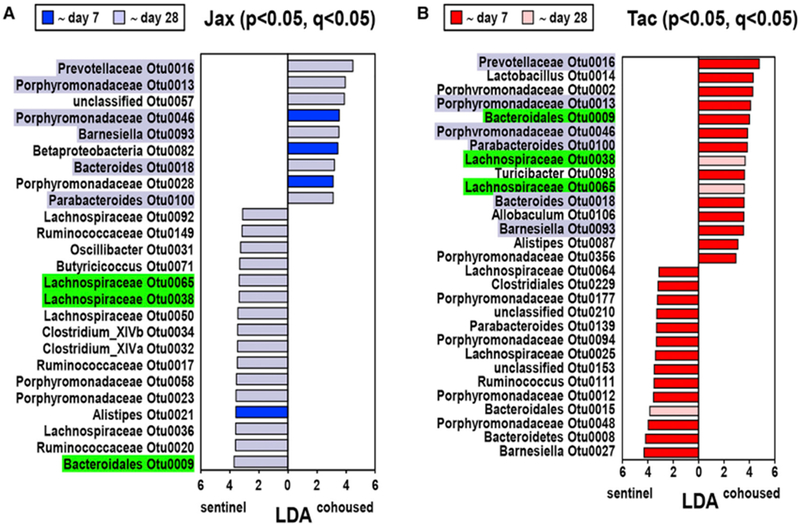
Figure 4. Asymmetric Kinetics of OTU Changes in Jax and Tac Mice after Cohousing.

LEfSe values of OTUs that were differentially abundant between the microbiota of sentinel and cohoused (for 28 days) mice with p<0.05, and maximal abundance cut < 1%. OTUs with a false positive rate q < 0.05 are shown (the numbers of cohoused and sentinel Jax and Tac mice are the same as shown in Figure 2). Data are pooled from four independent experiments. OTUs differences between cohoused and sentinel Jax (A) and Tac (B) mice that increase their abundance rapidly within 7 days (in dark blue and red) or with delayed kinetics (in light blue and pink) after cohousing. LDA and p values of OTUs at all time points analyzed in this study are available in Table S1. OTUs whose abundance is significantly different between cohoused and sentinel mice in both Jax and Tac are highlighted in blue and green. OTUs whose abundance is higher in cohoused compared to sentinel Jax mice are highlighted in blue, whereas OTUs whose abundance is lower in cohoused Jax mice are highlighted in green. No OTUs whose abundance is lower in cohoused Tac mice compared with sentinel Tac animals were part of the group of OTUs that were differentially abundant in cohoused versus sentinel Jax mice. See also Table S1.
