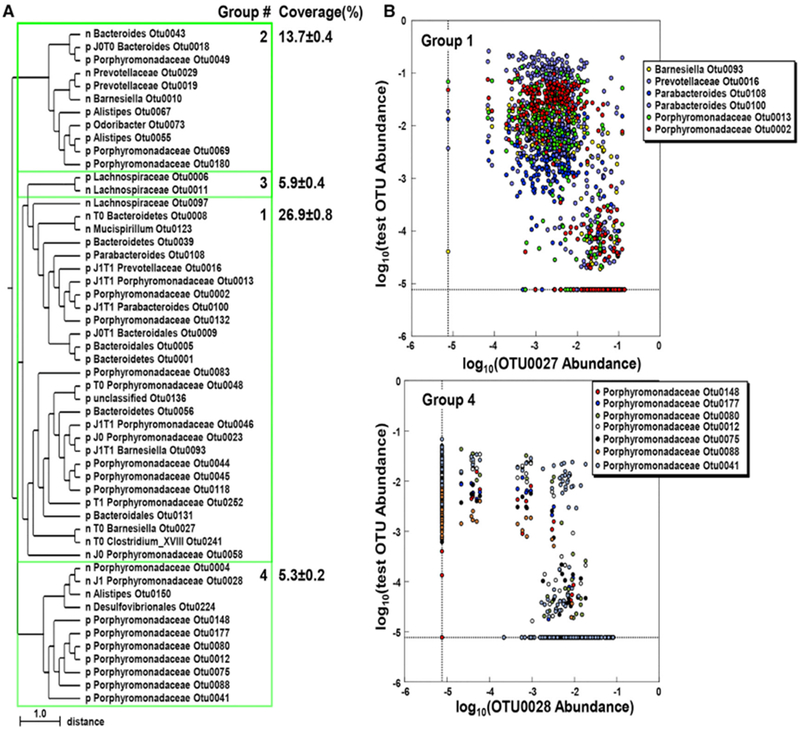
Figure 6. Negative Correlations in OTU Abundance in Jax and Tac Mice.

(A) Clustering analysis of OTU abundance. OTUs with the highest SparCC correlation coefficient absolute values (> 0.623, top 1%) and maximal abundance >1% in the microbiota of Jax and Tac mice were hierarchically clustered. Co-abundance groups 1-4 were defined with the same SparCC correlation coefficients absolute values (|SparCC| > 0.623) for positively (p) and negatively (n) correlated bacteria, respectively. OTUs that changed during cohousing are labeled as J0 for increased in Jax mice, J1 for decreased in Jax mice, T0 for increased in Tac mice, and T1 for decreased in Tac mice at day 28 after cohousing, according to Figure 4. The closest pairs of negatively correlated OTUs are shown with their distances on the tree. All correlations shown are significant with p < 0.001.
(B) Distribution of negatively correlated OTUs in individual mice (circle). The upper and lower panels show six representative pairs of negatively correlated OTUs ingroup 1 (each OTU shown inside the box was tested versus OTU0027) and group 4 (each OTU shown inside the box was tested versus OTU0028), respectively.
See also Table S2.
