Fig. 5.

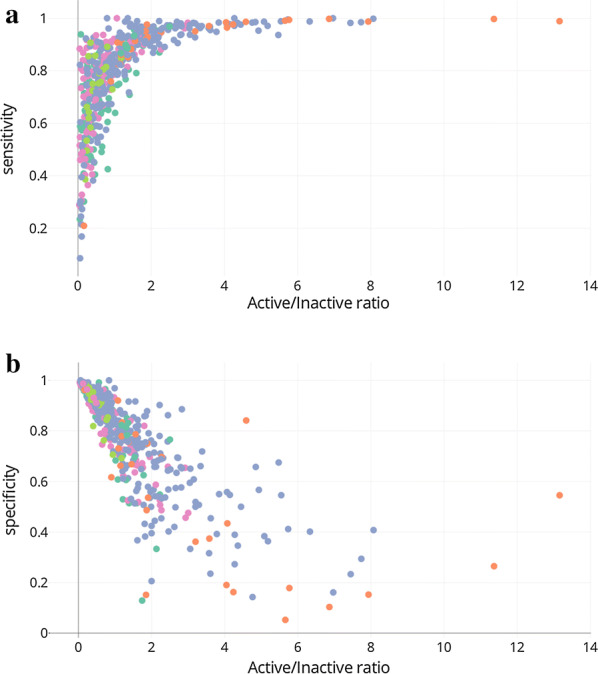
Sensitivity (a) and specificity (b) versus the ratio of active to inactive compounds for each QSAR models. Colours represent the protein families as described in the legend of the Fig. 3

Sensitivity (a) and specificity (b) versus the ratio of active to inactive compounds for each QSAR models. Colours represent the protein families as described in the legend of the Fig. 3