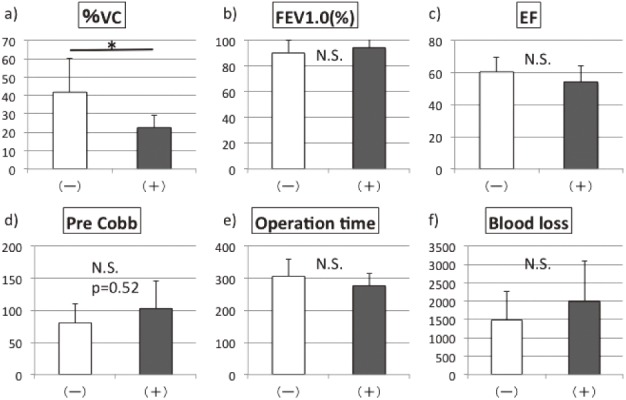
Figure 1.

Comparison of (a) preoperative %VC, (b) preoperative FEV1.0 (%), (c) preoperative ejection fraction (EF), (d) preoperative Cobb angle, (e) operative time, (f) blood loss between the group with major complications (+) and the group without major complications (-).
