Figure 2.

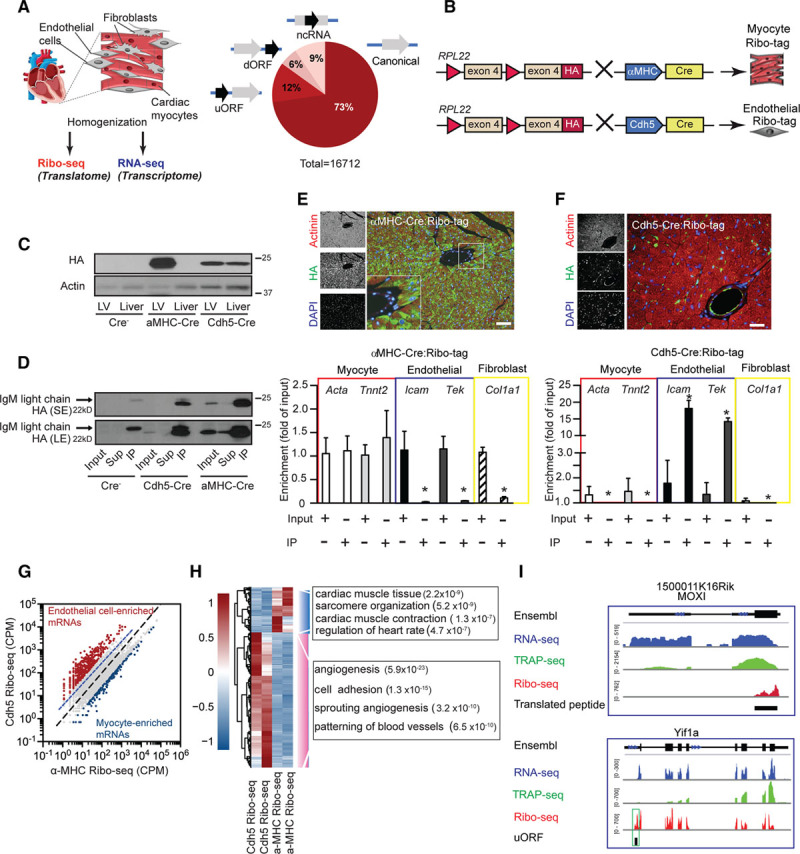
Cell-type–specific ribosome profiling in the mouse heart. A, Overview of Ribo-seq and RNA-seq approach combined with Ribo-tag. Predicted actively translated open reading frames (ORFs) from Ribo-seq data of mouse ventricular tissue and predicted active translation of using the Rp-bp approach.10 B, Schematic drawing of Ribo-seq strategy for cell-type–specific ribosome profiling. C, Immunoblotting of αMHC-Cre:Ribo-tag and Cdh5-CreERT2:Ribo-tag left ventricle and liver lysates. D, Immunoblot of αMHC-Cre:Ribo-tag and Cdh5-CreERT2:Ribo-tag left ventricle lysates after anti-HA (hemagglutinin) immunoprecipitation. E (upper), Immunofluorescence microscopy of heart sections from αMHC-Cre:Ribo-tag hearts. HA antibody (green), actinin (red), and nuclei (blue). Scale bar =100 μm. E (lower), Enrichment of transcripts after anti-HA immunoprecipitation from αMHC-Cre:Ribo-tag lysates. N=3; *P<0.01. F (upper), Immunofluorescence microscopy of heart sections from Cdh5-CreERT2:Ribo-tag hearts. Scale bar =100 μm. F (lower), Enrichment of transcripts after anti-HA immunoprecipitation from Cdh5-CreERT2:Ribo-tag left ventricle lysates. n=3; *P<0.01. Two-tailed Student unpaired t test for E and F. G, Comparison of αMHC-Cre and Cdh5-Cre Ribo-seq libraries. Endothelial-enriched transcripts (red dots) and myocyte-enriched transcripts (blue dots; log2-fold change >2). N=2 individual libraries for each condition. H, Clustering analysis of endothelial and myocyte-enriched transcripts. Hierarchical clustering analysis was performed with the R package ‘pheatmap’ using ‘ward.D2’ and ‘euclidean’ distance algorithm. Scale: scaled gene expression. Enrichment of significant gene ontology terms in the group of regulated genes (Fisher exact test, −log10 P value). I, Ribo-seq (red), RNA-seq (blue), and TRAP (translating ribosome affinity purification)-seq (green) coverage plots for the M. musculus genome loci containing MOXI (ncRNA with a translating ORF) and Yif1a (reads mapped to the 5′ UTR). dORF indicates downstream open reading frame; LE, long exposure; MOXI, micropeptide regulator of β-oxidation; ncRNA, noncoding RNA; SE, short exposure; uORF, upstream open reading frame; and UTR, untranslated regions.
