
Figure 4.
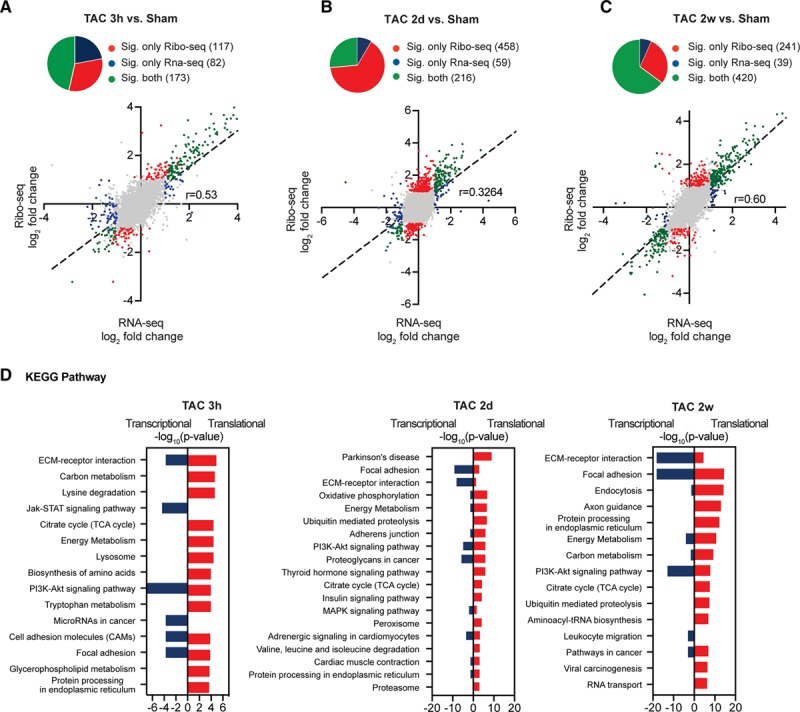
Regulated transcript networks after acute and chronic cardiac stress. A–C, Scatter plots of Ribo-seq vs RNA-seq in sham- and transverse aortic constriction (TAC)-operated mice. Transcripts were considered significant when false discovery rate <0.05. Gray dots indicate no significant change. Significant change at translational level is shown in red, at transcriptional level in blue, and regulation at both translational and transcriptional levels in green. N≥3 for each time point. D, Enrichment of Kyoto Encyclopedia of Genes and Genomes (KEGG) terms for differentially expressed genes. −log10 P values, Fisher exact test. ECM indicates extracellular matrix; FDR, false discovery rate; STAT, signal transducer and activator of transcription; and TCA, tricarboxylic acid cycle.