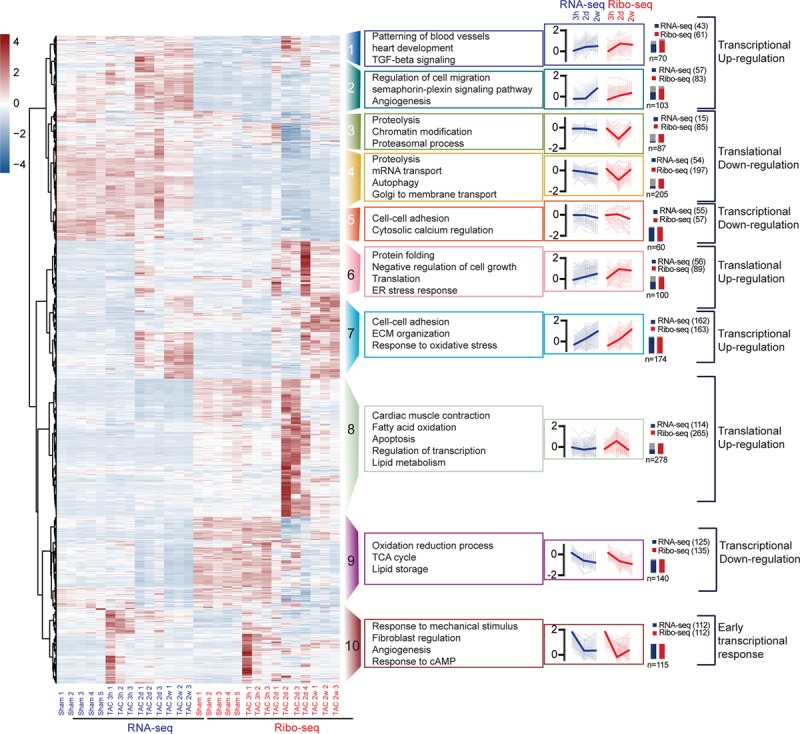
Figure 5.

Regulated transcript networks after acute and chronic hemodynamic stress. Unbiased clustering analysis of Ribo-seq and RNA-seq of DEGs 3h, 2d, and 2w after transverse aortic constriction (TAC) surgery. Different colors indicate different clusters. Lines of each gene are transparent, and the lines of average values are in bold in each cluster. Numbers indicate significant genes by RNA-seq or Ribo-seq in the cluster and the total number of genes within the cluster (n). Scale: scaled gene expression. cAMP indicates cyclic adenosine monophosphate; ECM, extracellular matrix; ER, endoplasmic reticulum; TCA, tricarboxylic acid cycle; and TGF, transforming growth factor.
