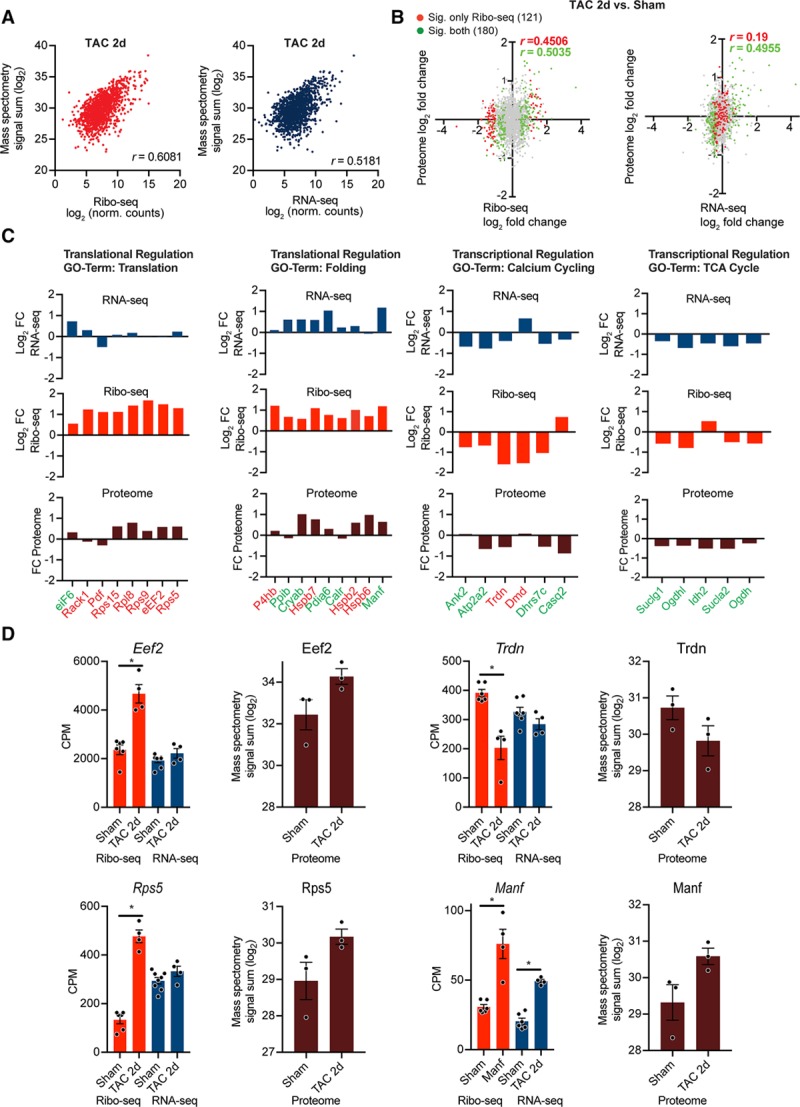
Figure 6.

Mass spectrometry-based validation of translationally regulated transcripts. A, Gene-based scatterplot showing the correlation between Ribo-seq (red) or RNA-seq expression levels (blue) and protein abundance derived from isolated myocytes 2 days post surgery. Correlation coefficients are Pearson r values. B, Scatter plot of Ribo-seq or RNA-seq vs changes in protein abundances after transverse aortic constriction (TAC) surgery. Gray dots indicate no significant change, differentially expressed genes (DEGs) at translational level (Ribo-seq) are shown in red, DEGs at transcriptional level (RNA-seq) in green. Correlation coefficients are Pearson’s r values. C, Transcriptional and translational regulation of DEGs and changes in overall protein abundance of genes related to different biological processes from identified clusters in Figure 5. Translationally regulated transcripts (Ribo-seq, false discovery rate [FDR] <0.05) are highlighted in red, transcriptionally regulated transcripts (RNA-seq, FDR <0.05) in green. D, Examples for translational regulation (eEF2, Rps5, and Trdn) and transcriptional regulation (Manf). N=7 Sham, n=4 TAC. Mass spectrometry was performed on myocytes from n≥3 individual mice after TAC or Sham surgery. *FDR <0.05. CPM indicates counts per million.
