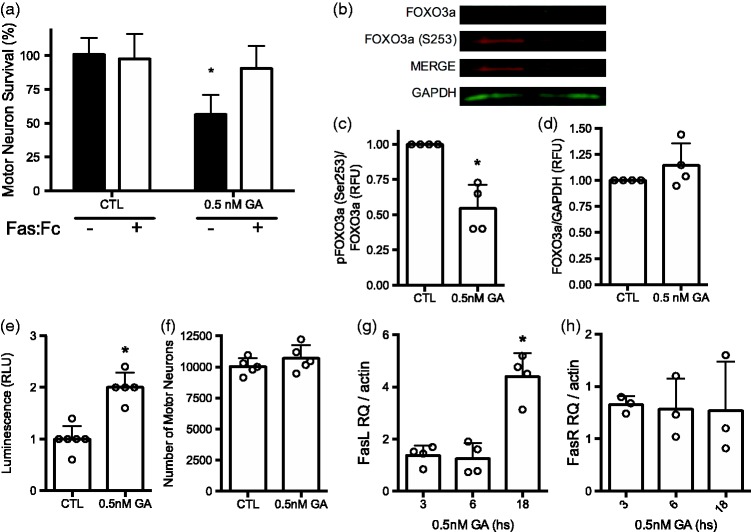
Figure 5.
Hsp90 inhibition induces FOXO3a- and Fas-dependent motor neuron apoptosis. (a) Motor neurons were cultured with trophic factors and incubated with or without 0.5 nM geldanamycin alone or in combination with 1 µg/mL Fas:Fc (+) for 24 h before determine survival as described in Materials and Methods. The data were analyzed using two-way ANOVA followed by Sidak’s multiple comparisons test. *P < 0.05 versus CTL. (b) Representative infrared Western blot for total FOXO3a and FOXO3a phosphorylated at serine 253 [FOXO3a (S253)] in homogenates of motor neurons treated with 0.5 nM geldanamycin (GA) for 16 h. (c) Quantification of four western blots showing FOXO3a-S253 fluorescent intensities respect to total FOXO3a, the ratios were standardized between experiments using the values of control. *P < 0.001 vs. control. (d) Total relative expression of FOXO3a respect to GAPDH was calculated and standardized as described in (c). For (c) and (d) for all panels, columns represent the mean ± SD of the indicated number of independent experiments for each graphic, while the circles represent the individual values used to calculate the mean and SD. (e) Motor neurons were transduced with adenoviral particles expressing luciferase under the control of fork head response element (FHRE) and incubated for 24 h before treating the cultures with 0.5 nM geldanamycin for additional 16 h, at which time the luminescence was quantified. Bars represent the mean ± SD of five experiments performed in octuplicate. Circles are the mean of the replicates of each one of the independent experiments. *P < 0.01 vs. control. (f) Motor neuron cultures used in (e) were stained with calcein. AM and the number of motor neurons were determined as described in material and methods. Bars represent the mean ± SD of five experiments performed in octuplicate. Circles are the mean of the replicates from each one of the independent experiments. Statistical analysis in (c), (d), (e) and (f) was performed using the unpaired t test. (g) Quantitative RT-PCR for Fas ligand normalized to β-actin. Motor neurons were cultured with and without geldanamycin for the indicate times before total RNA was extracted and processed as described in materials and methods. Values are standardized to the ratio Fas ligand to β-actin in motor neurons cultured without geldanamycin. Bars represent the mean ± SD of four experiments performed in triplicate. Circles are the mean of the independent experiments. *P < 0.001 vs. untreated, 3 and 6 h. By Kruskal–Wallis test followed by Dunn’s multiple comparisons test. (h) Quantitative RT-PCR for Fas receptor normalized to β-actin. Cultures and treatments were performed as described in (g).

