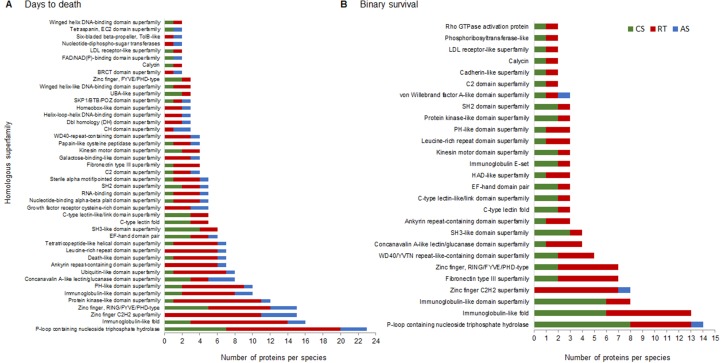
Figure 4.
Homologous superfamilies (InterPro) adjacent to the complete set of SNPs that explain more than 1% of the genetic variance of resistance to SRS measured as DD (A) and BS (B). Bars represent the abundance of genes in each homologous superfamily present in at least two salmonid species. CS, RT, and AS.

