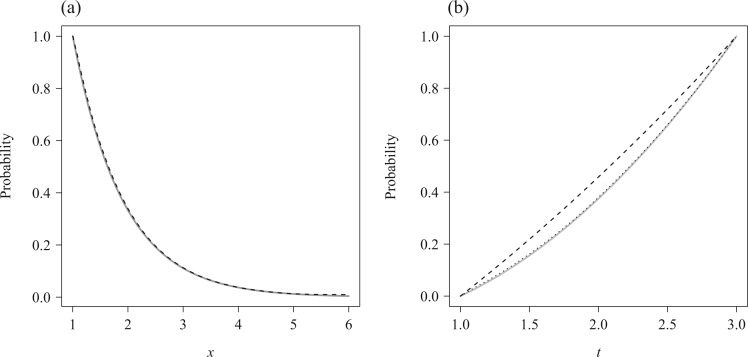
Fig. 1.
Simulation results for the estimation of: (a)  , with a grey solid line depicting the true curve and a black dashed line depicting the average of Kaplan–Meier estimates; (b)
  , with a grey solid line depicting the true
  , a black dotted line depicting the average of the estimates of Wang (1991), and a black dashed line depicting
  .
.

