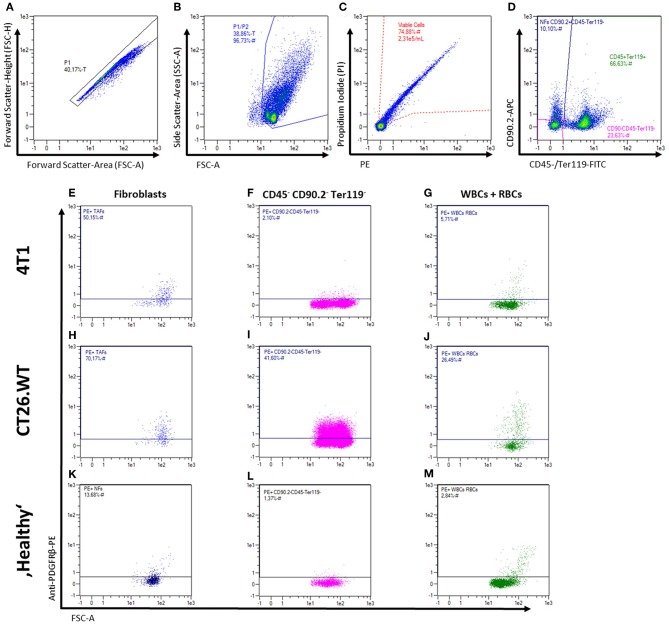
Figure 2.
Flow cytometric analysis of fibroblasts from solid tissues. (A–M) Representative gating strategy and read-out for analysis of cell surface marker expression. First, cells are gated in a FSC-A vs. FSC-H plot to exclude doublets (A), followed by exclusion of debris in a FSC-A vs. SSC-A plot (B), and dead cell exclusion on a PE-A vs. PI-A plot (C). Fibroblasts, leukocytes (WBCs), erythrocytes (RBCs), and triple-negative cells were then gated in a plot of FITC-A (CD45 and Ter119) vs. APC-A (CD90.2; D) for independent analysis of the different populations and mean fluorescence intensity levels (E–M). Representative expression patterns of PDGFRβ (CD140b) are shown for 4T1 and CT26.WT tumor cells as well as for bulk skin and mammary fat pad cells from BALB/c mice.

