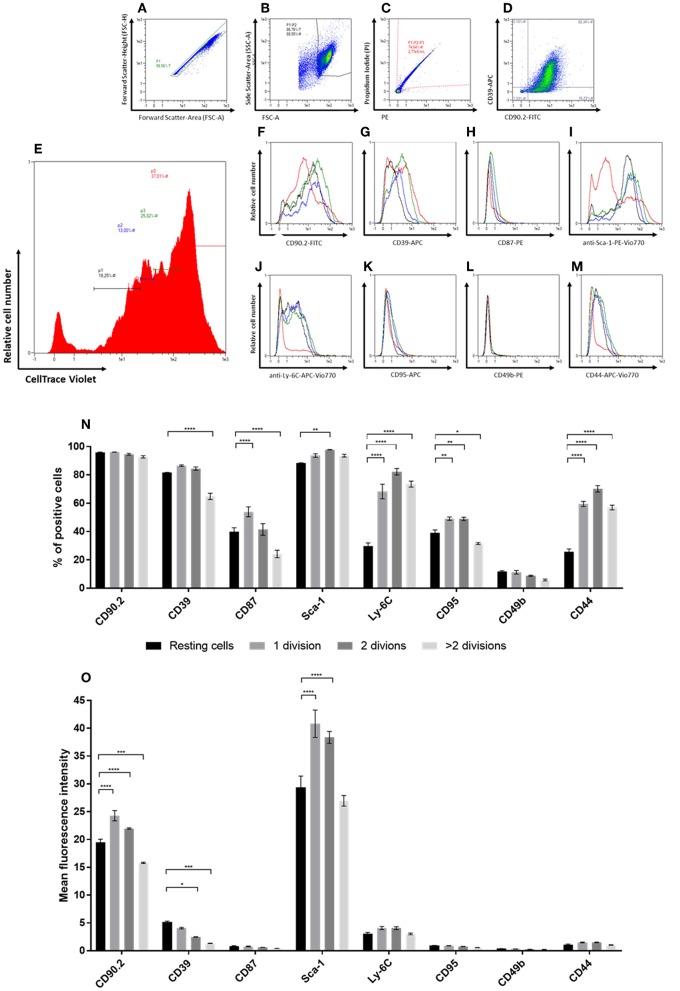
Figure 4.
In vitro generational tracing assay. (A–M) Representative gating strategy and read-out for proliferation assay. First cells are gated in a FSC-A vs. FSC-H plot to exclude doublets (A), followed by exclusion of debris on a FSC-A vs. SSC-A plot (B) and dead cell exclusion on a PE-A vs. PI-A plot (C). The percentage of fibroblasts and the “NF phenotype” is confirmed in a FITC-A (CD90.2) vs. APC-A (CD39; D) plot. For proliferation analysis, populations with different numbers of cell divisions, represented by different peaks, are gated in a histogram indicating the CellTrace Violet fluorescence intensities (E). The peak of cells with the highest CellTrace Violet fluorescence represented cells that did not divide, accordingly referred to as “resting” cells (red). The peaks with gradually lower CellTrace Violet fluorescence represented cell populations with increasing numbers of cell divisions, referred to as “1 division (green),” “2 divisions (blue),” and “>2 divisions (black),” respectively. Histograms of the populations with different numbers of cell divisions in vitro indicate the levels of expression for the different markers (CD90.2, CD39, CD87, Sca-1, Ly-6C, CD95, CD49b, and CD44; F-M). (N,O) The expression levels of the different markers within populations after distinct numbers of cell divisions are compared based on the percentage of cells expressing the respective marker (N) and expression level depicted as mean fluorescence intensities (MFIs) of the respective markers (O). Proliferation analysis has been performed in triplicates in two independent experiments. Data are reported as mean and SEMs for three replicates and statistical analysis was performed using the two-way ANOVA (*P < 0.05; **P < 0.005; ***P < 0.0005; ****P < 0.0001).

