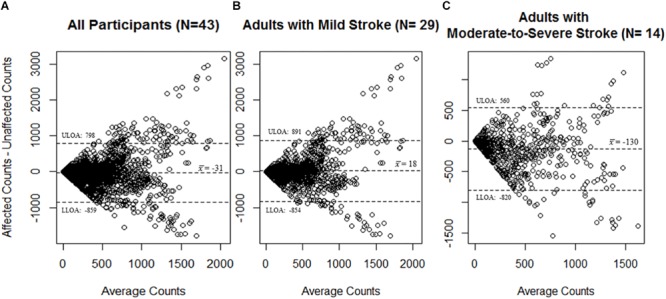
FIGURE 1.

Bland–Altman plots for agreement of the MotionWatch8 for (A) all participants (N = 43); (B) participants with mild stroke (N = 29); and (C) participants with moderate-to-severe stroke (N = 14). Differences between counts reported by the stroke affected side MW8 and the stroke non-affected side MW8 are reported. A greater amount of activity was associated with less agreement between the affected side MW8 and non-affected side MW8, irrespective of stroke severity. Dotted lines represent upper and lower limits of agreement. ULOA: Upper Limit of Agreement; LLOA: Lower Limit of Agreement.
