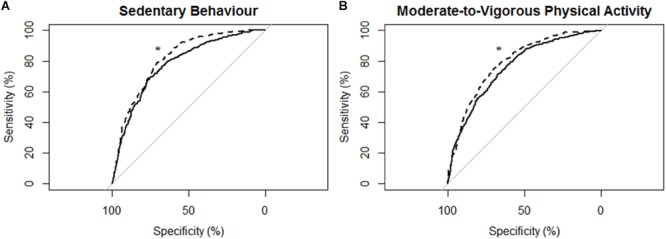
FIGURE 2.

Receiver operating characteristic (ROC) curves and corresponding area under the curves (with 95% confidence interval; AUC) for all participants (N = 43) with the MotionWatch8 (MW8) placed on either the non-affected side or the stroke affected side. (A) ROC curve for sedentary behavior with MW8 placed on the non-affected side (–) vs. affected side (- - -). We found there was moderate diagnostic accuracy for the non-affected side (AUC = 0.777; 95% CI: [0.754–0.801]), and moderate diagnostic accuracy for the affected side (AUC = 0.814; 95% CI: [0.794–0.834]). (B) ROC curve for moderate-to-vigorous physical activity with MW8 placed on the non-affected side (–) vs. affected side (- - -). We found there was moderate diagnostic accuracy for the non-affected side (AUC = 0.758; 95% CI: [0.738 – 0.779]), and moderate diagnostic accuracy for the affected side (AUC = 0.792; 95% CI: [0.773–0.810]). *Significant difference in diagnostic accuracy between ROC curves (DeLong et al., 1988).
