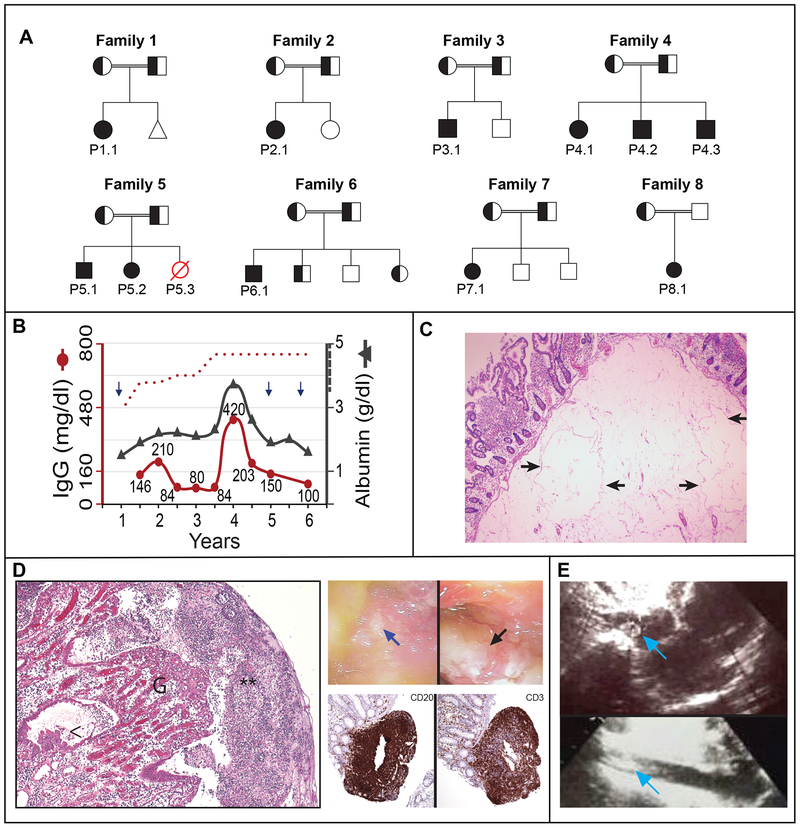
Figure 1. Clinical presentation of 8 families with familial early-onset protein-losing enteropathy.
Panel A shows pedigrees of eight families with affected individuals homozygous for mutant allele indicated by solid symbols, heterozygous individuals indicated by half solid symbols, and affected individuals with an unknown genotype indicated by red, open symbols. The triangle in Family 1 represents a miscarriage. Panel B shows the serum levels of immunoglobulin G (IgG, left Y axis) in relation to serum albumin (right Y axis) concentrations as a function of age in years for Patient 1.1. Age-specific lower cutoff value for IgG is denoted by the red dotted curve, whereas the reference for albumin level is >3.5 g/dl (indicated by hatched line on right Y axis). Each arrow denotes an episode of pneumonia. Panel C shows H&E sections of resected duodenal tissue with markedly dilated lymphovascular spaces within submucosa in Patient 5.2 (arrows). Panel D (left) shows H&E sections from surgical resection material of small intestine which exhibits ulceration covered by fibrin with dense granulocytic infiltrate (**), granulation tissue (G) with edema in the lamina propria and reactive epithelial changes (<) in Patient 2.1 (left), as well as endoscopy photographs showing a mucosal ulcer (blue arrow) and exudate (black arrow) in the terminal ileum of Patient 1.1 (right, top) and histopathology of a biopsy of the ileum of Patient 2.1 and immunohistochemistry showing presence of B cells (CD20) and T cells (CD3) within lymphoid nodules (right, bottom). Panel E shows an echocardiographic image from Patient 6.1 with thrombus in the right atrium (arrow, top) and inferior vena cava (IVC) (arrow, bottom).

